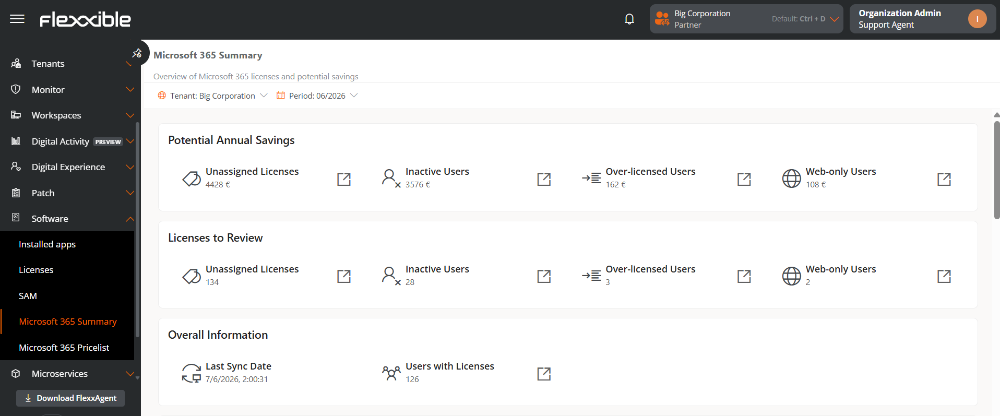
Microsoft 365 Summary
This section provides an overview of the use and consumption of Microsoft 365 licenses within the organization. Its purpose is to identify opportunities for optimization and cost reduction by analyzing contracted licenses, their assignment, and the actual use users make of Microsoft applications.
The available information helps answer questions like:
- What potential savings exist for contracted licenses that are not assigned?
- What licenses are assigned to inactive users, and what is their cost?
- Are there users with more comprehensive licenses than they actually need?
- What users only use web applications and might require a different type of license?
- How do these metrics evolve over time?
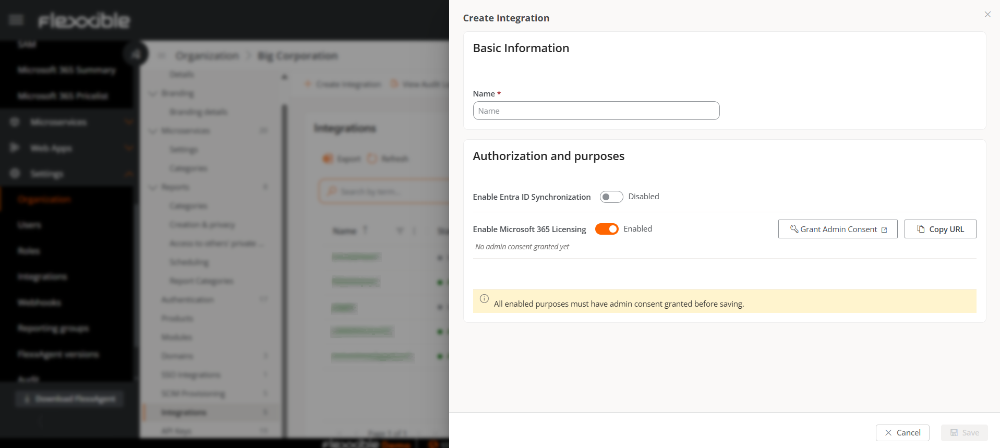
Requirement
This feature is not enabled by default. To access it, you first need to enable Microsoft 365 licensing from the Integrations section.
Information Panels
Information is organized in panels that show relevant indicators about license usage and optimization:
At the top of this view, there are two selectors, Tenant and Period, that allow filtering the data seen in each info panel. The selection does not apply to the Historical Evolution Charts.
Period
Allows selecting the time interval for which you want to consult the information.
- The available periods always correspond to calendar months.
- Only periods for which data is available are shown.
- By default, the most recent period is selected.
Tenant
If the organization has more than one configured tenant, this selector lets you choose the source of the data to be displayed in the view.
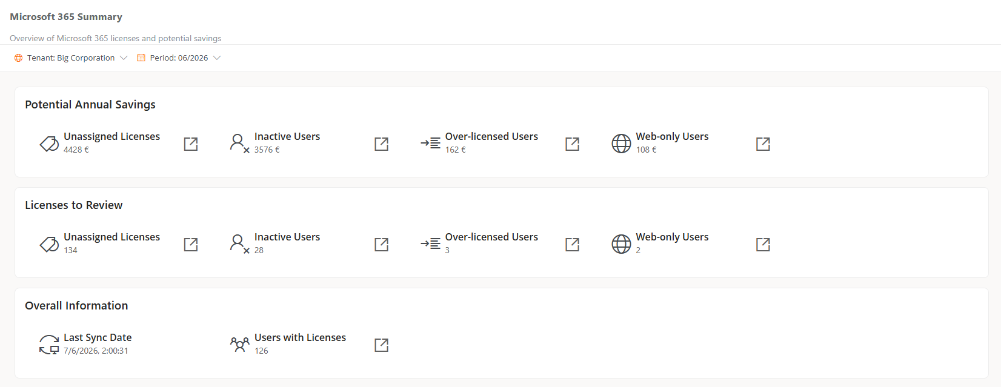
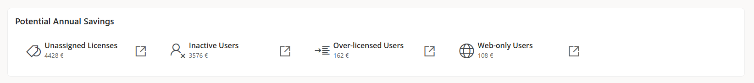
Potential Annual Savings
Shows an estimate of the annual savings that could be achieved through license optimization.
-
Unassigned Licenses. Estimated annual amount corresponding to contracted licenses not assigned to any user.
-
Inactive Users. Estimated annual amount corresponding to licenses assigned to users without activity in the last 90 days.
-
Users with Excess Licenses. Estimated annual amount corresponding to users with more comprehensive licenses than necessary based on their use of Microsoft applications.
-
Web Only Users. Estimated annual amount corresponding to users who exclusively use web applications, even though they have licenses that include desktop applications.
Licenses to Review
Shows the number of users or licenses within the licensing:

- Unassigned Licenses. Contracted licenses not assigned to any user.
- Inactive Users. Users with an assigned license and no activity in the last 90 days.
- Users with Excess Licenses. Users who might have a license higher than what they need.
- Web Only Users. Users who only use web applications.
General information
Shows basic information about the current state of licensing data.
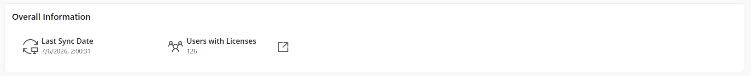
- Date of Last Synchronization. Date and time of the last update of the licensing data.
- Users with Licenses. Total number of users with at least one assigned license.
Data synchronization processes occur once a week and are recorded in the Operations section.
Reports
To consult the details of the data, each panel provides a shortcut to the corresponding report in the Reports section.
Historical Evolution Charts
The charts in this section allow analyzing the time evolution of optimization metrics and checking the impact of measures applied on the use of licenses.
Evolution of Potential Annual Savings
Shows the monthly evolution of the following metrics:
- Unassigned licenses
- Inactive users
- Users with Excess Licenses
- Web-only users
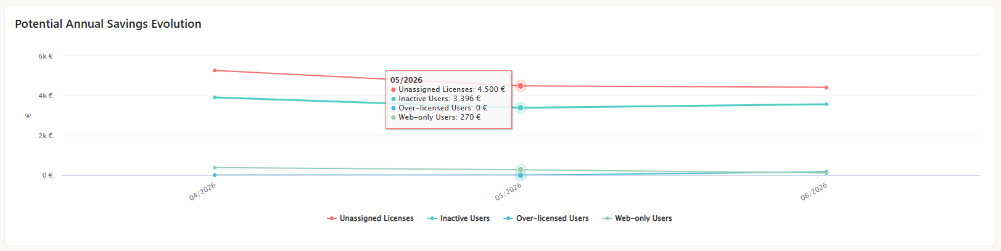
The graph allows comparing the evolution of the estimated potential annual savings for each of the analyzed categories.
Hovering over a point on the graph shows the values corresponding to that period.
Evolution of Licenses
Shows the monthly evolution of the following metrics:
- Unassigned licenses
- Inactive users
- Users with Excess Licenses
- Web-only users
- Users with Licenses
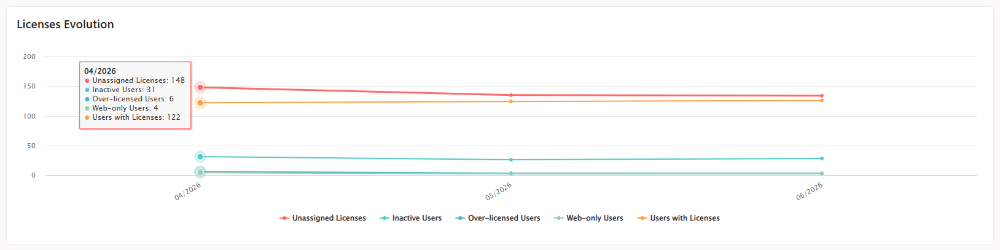
The graph shows how different licensing metrics evolve over time and assesses the impact of the optimization measures applied.
Hovering over a point on the graph displays the values for the selected period.
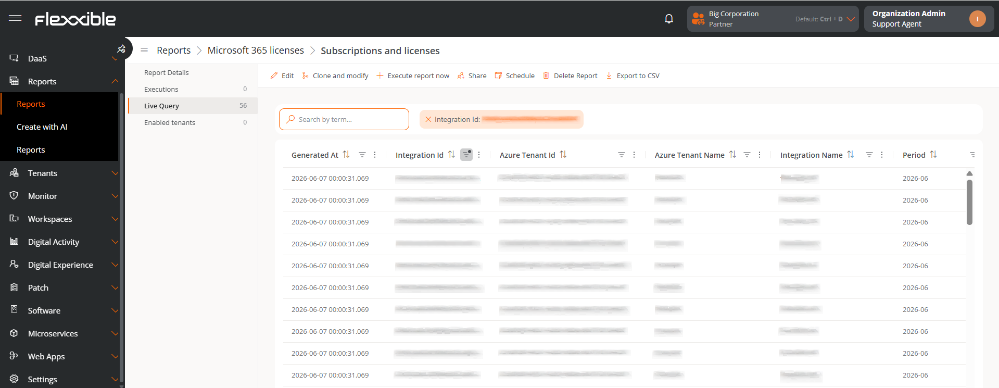
Subscriptions and licenses
Shows detailed information about contracted licenses, their consumption, and their status.
Table info
The table shows the following information:
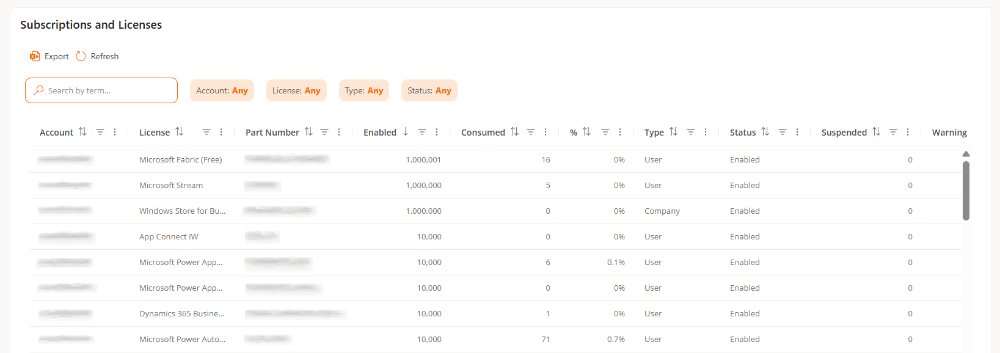
- Account. Microsoft Entra ID tenant to which the subscription belongs.
- License. Name of the contracted license.
- Product Code. Reference code for the license.
- Enabled. Total number of available licenses for the subscription.
- Consumed. Number of licenses currently assigned to users.
- %. Percentage of assigned licenses compared to the total available.
- Type. Type of subscription or license modality.
- Status. Current state of the subscription.
- Suspended. Number of licenses included in suspended subscriptions.
- Warning. Number of licenses in a warning state requiring some administrative action.
- Blocked. Number of licenses whose access to services has been restricted by Microsoft.
- Next Lifecycle. Date on which the next change in the subscription lifecycle will occur.
- Trial. Indicates if the subscription corresponds to a trial version.