Monitor
Monitor is a monitoring module based on Grafana Cloud, which allows you to graphically view information obtained from Workspaces and Analyzer. It queries data from the APIs and displays them in custom graphs for good information management. Its main function is to help monitor and analyze various data sources in real-time, facilitating the interpretation and tracking of systems and applications.
System and application monitoring
Monitor supervises systems and applications. It can monitor the status and performance of devices linked to Workspaces, as well as the applications installed on them.
Real-time data visualization
With Monitor, you can see all the information from Workspaces and applications in real-time. It allows setting specific time intervals for each dashboard to emphasize specific moments. It also helps identify and prevent errors as they happen and to analyze incidents by time intervals.
Analysis and reports
One of Monitor's key features is its ability to analyze data in detail and generate automatic reports. This is useful to understand how resources work, make informed decisions, and improve efficiency.
Data sources
Monitor can integrate with multiple data sources. This functionality allows gathering and visualizing information from different tools. Currently, by obtaining data from Workspaces and Analyzer, it can provide a complete view of the systems and applications, integrating queries to observe specific data. This integration offers various benefits such as centralizing information, correlating it, and flexibility when graphing it.
Dashboards
One of Monitor's most powerful features is its dashboards, which allow you to visualize, analyze, and monitor data more efficiently by creating panels that display information obtained from data sources.
These panels not only display data graphically but also offer interactivity with the user, allowing exploration of information, application of filters, and adjustment of time ranges to analyze trends or patterns.
Some functionalities of the dashboards:
- Full customization
- Interactive visualization
- Share and collaborate
Alerts and notifications
Configurations that monitor a specific metric and send alerts when it reaches a predefined threshold. This feature allows you to stay informed in real-time about important events and take action when necessary, facilitating intervention and minimizing the impact of potential problems before they become critical incidents.
User and permissions management
User and permissions management allows controlling who can access the dashboards, what actions users can perform, or limit access to certain data sources, helping to secure and maintain the integrity of the information.
Some key functions in user and permission management:
- User groups: allows managing users by groups, facilitating the management of permissions at a group level.
- Folder and dashboard access control: permissions can be configured at the folder or dashboard level, allowing control over who can access certain information.
Access
'Monitor' can be accessed from Portal. By clicking on the module, you'll go to the home page.
- Select the
Sign Inoption to log in. - Enter username and password.
Navigate
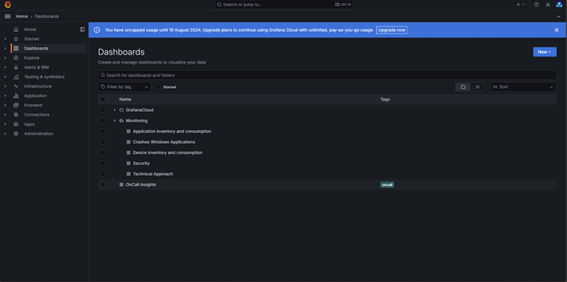
To access all available charts and navigate through them, select Dashboards -> Monitoring.
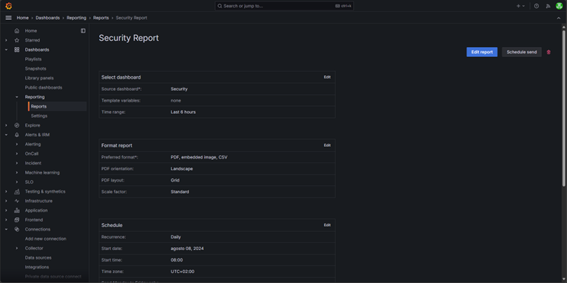
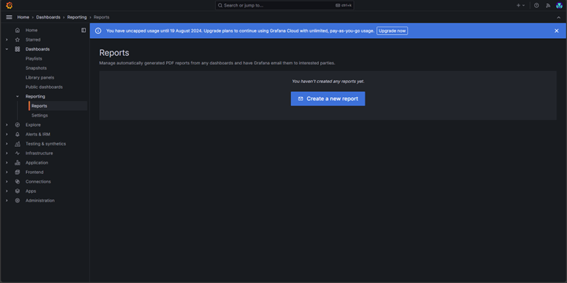
You can configure or manage automatic or on-demand reports by accessing Dashboards -> Reporting-Reports.
Default dashboards
There are five default charts that allow managing different aspects of the environment:
- Technical focus
- Windows application errors
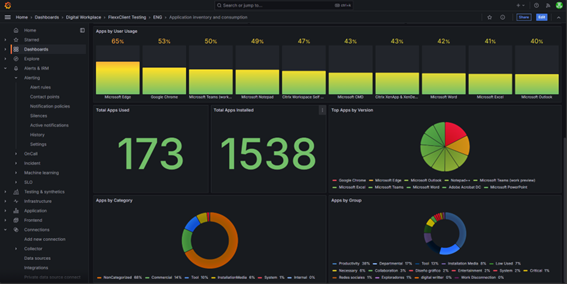
- Application inventory and consumption
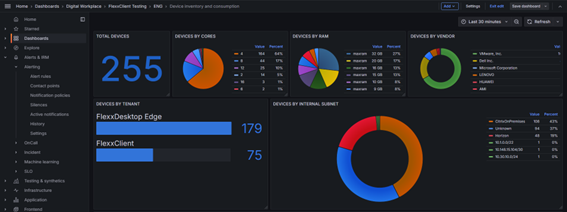
- Device inventory and consumption
- Security
It is possible to adapt or create custom charts depending on the focus or usage.
Use Cases
The following presents a series of use cases to describe the possibilities of Monitor.
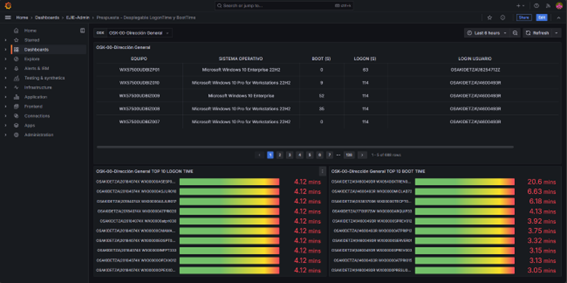
Uptime monitoring
If you need to ensure devices comply with usage policies by monitoring uptime and user logon time.
With Monitor, you can create detailed charts that show the power-on time of each device and the user's session start time. It also offers the option to apply filters for a clear and detailed view of devices showing high times or to generate a periodic report with this data. All of this is useful if the organization needs to ensure its devices comply with usage policies.
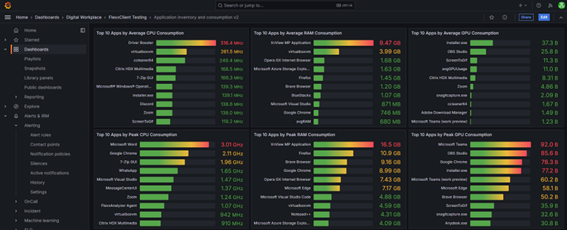
Application monitoring
You need to control consumption on devices, monitor the usage of a group of applications or a specific application.
Monitor creates charts that gather information about consumption, application usage, versions, etc. Thanks to Monitor's dashboards, it is possible to have an overall view of device usage to know how to act based on the analysis results.
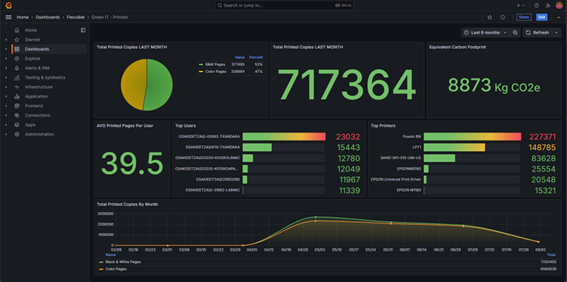
Environmental impact assessment
Given the significant number of copies made per printer in the last month, it is necessary to monitor and manage the environmental impact associated with these activities, and thus take measures to reduce the carbon footprint generated by printers.
By obtaining the data from Green IT it is possible to create monitoring and management panels that allow you to see the analysis of the environmental impact created, taking into account factors such as color, black and white prints, equipment switching on time, etc.