Alert Configuration
The Alert Settings section allows you to consult, manage, and create alerts associated with system events on a device. From this view, you can enable or disable an alert and link it to one or several microservices for automatic resolution.
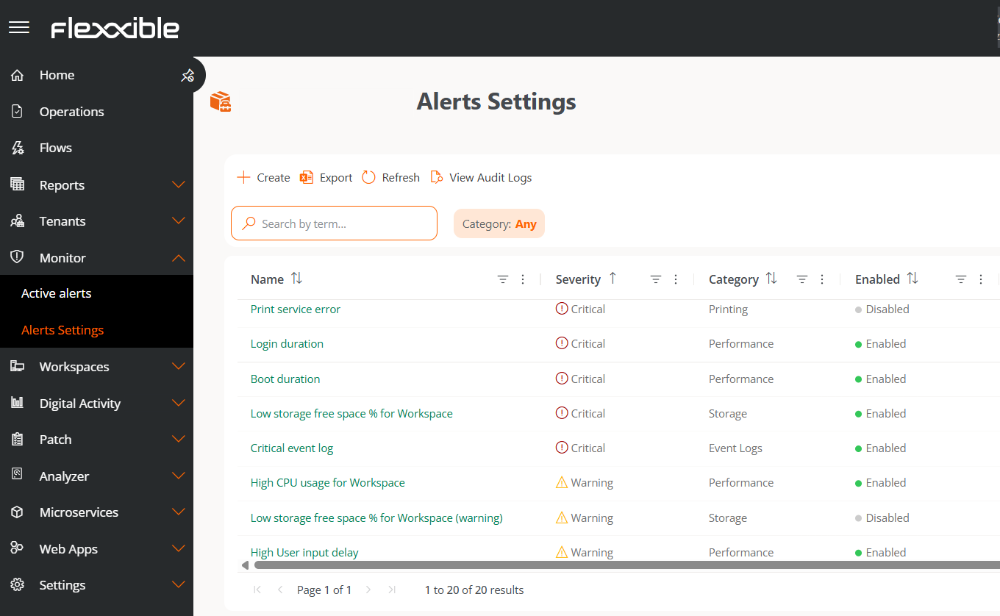
List view
This view shows a list of alerts registered on the device. The table fields include:
-
Name. Name of the alert.
-
Severity. Impact level of the alert on the system. Check the levels here.
-
Category. Classification of the alert. Check the categories here.
-
Threshold. Numeric value defining the age in minutes to search for the event. The default value is 720 minutes and the minimum allowed is 60 minutes.
If the threshold is less than the 60-minute interval, the alert might not activate.
The threshold defines the numeric value of the age in minutes to search for the event.
-
Threshold unit. Minutes.
-
Authorized time (minutes). Maximum time allowed for a condition before it is considered an anomalous event.
-
Repeat every (minutes). Time that will pass before sending a new alert if the condition persists.
-
Enabled. Indicates if the alert is enabled or disabled.
FlexxAgent collects system events, by default, every 30 minutes. This time can be set in the FlexxAgent settings at both Reporting Group and Product levels.
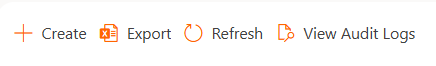
Actions from the list view
From the list view, you can perform the following actions:
| Button | Action |
|---|---|
| New | Allows you to create a new alert setting based on a system event. |
| Export | Downloads an Excel file with the records of the table. |
| Refresh | Updates the list. |
| View audit log | Allows access to the Audit section, to view records whose entity types correspond to Alert Configuration. |
Create an alert setting
The New button, located at the top of the main view, allows you to define an alert based on system events.
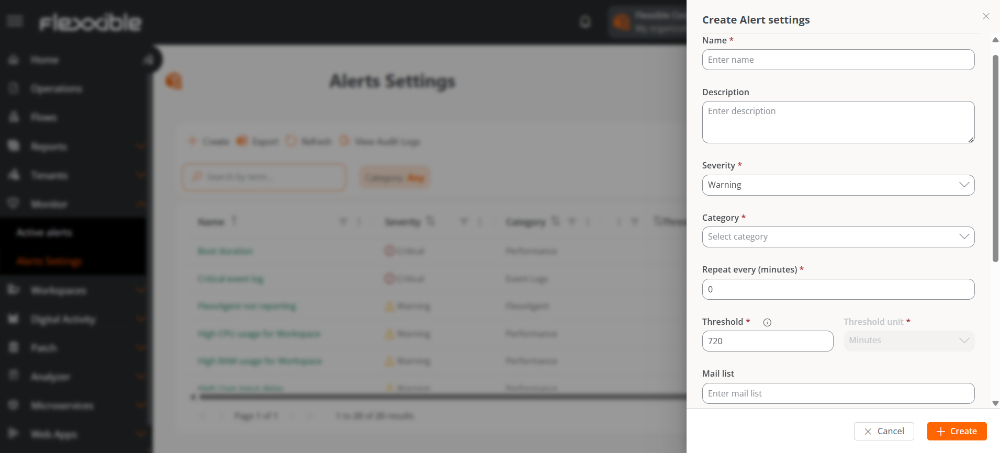
The creation form requests the following data:
-
Name. Name of the alert.
-
Description. Details of the alert's meaning.
-
Severity. Impact level of the alert on the system. Check the levels here.
-
Category. Classification of the alert. Check the categories here.
-
Repeat every (minutes). Time that will pass before sending a new alert if the condition persists.
-
Threshold. Numeric value defining the age in minutes to search for the event. The default value is 720 minutes and the minimum allowed is 60 minutes.
If the threshold is less than the 60-minute interval, the alert might not activate.
The threshold defines the numeric value of the age in minutes to search for the event.
-
Threshold unit. Minutes.
-
Authorized time (minutes). Maximum time allowed for a condition before it is considered an anomalous event.
-
Email recipients list. Email addresses (separated by commas) of users who will receive an alert notification.
-
Alert message. Notification that recipients will receive when the alert is triggered. For example: Event 786459 has occurred.
-
Event ID. Numeric identifier of the event in the Event Viewer. Only accepts a numeric value. An alert will be issued when an event with that ID is generated.
-
Search text. Full text or literal fragment of the message in the Event Viewer. It is always a text string. See example here.
-
Source. Value of the Source column in the Event Viewer. Equivalent to the
Provider Namefield in the event's XML. For example: Microsoft Office 16 Alerts. -
Exclude from UX score. Allows the alert to be excluded from the Workspace Reliability Index (WRI) calculation.
Example of search text
Configured alert message:
_The name resolution for _ldap._tcp.Tullahoma.sites.FlexxLab.com timed out after none of the configured DNS servers responded.
Valid search texts:
- Name resolution
- Timed out after none of the configured DNS servers responded
- None of the configured DNS servers responded
Invalid search text:
- Name resolution timed out after none of the configured DNS servers responded.
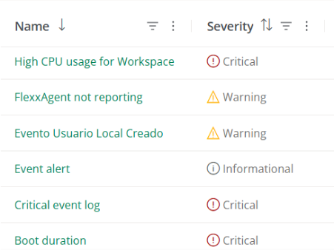
Alert Severity
There are three levels:
-
Informational. The event is not critical, but system performance could be optimized.
-
Warning. The event could compromise system performance if not addressed.
-
Critical. The event requires immediate attention because it compromises system performance.
Alert categories
Categories indicate the scope where the event originates:
- Connectivity
- FlexxAgent
- Hardware
- Performance
- Events logs
- Security
- Printing
- Storage
Alert activation
Alerts configured from system events are generated by detecting the event on the device, not by each individual occurrence of the event.
This implies:
- If the same event is logged multiple times on a device, multiple alerts will not be generated.
- A single alert will be generated per device upon detecting the first occurrence within the defined threshold.
- The alert will remain active as long as events continue to be detected within the configured interval.
- The alert will automatically deactivate when the time defined in the threshold has passed, counted from the last recorded occurrence of the event.
When looking to detect events that do not have a Critical level, it is necessary to add their ID in FlexxAgent settings as an additional event.
Detail view
Selecting an alert from the main table accesses its detail view, divided into four sections:
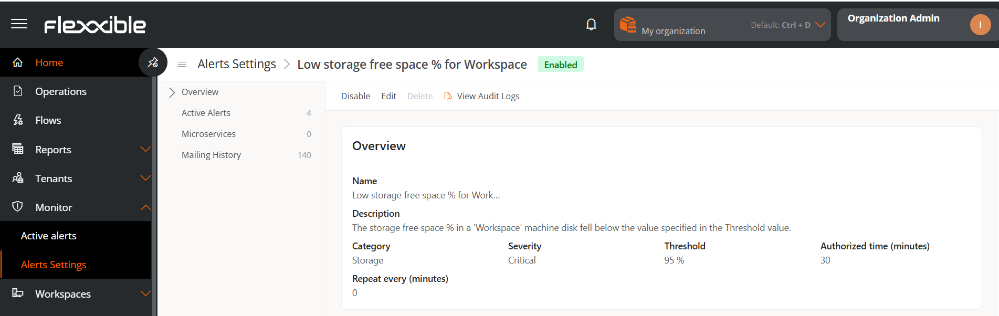
Overview
It provides the main data of the alert, defined at the beginning of this document.
- Name
- Caption
- Category
- Severity
- Threshold
- Authorized time (minutes)
- Repeat every (minutes)
- Exclude from UX Score
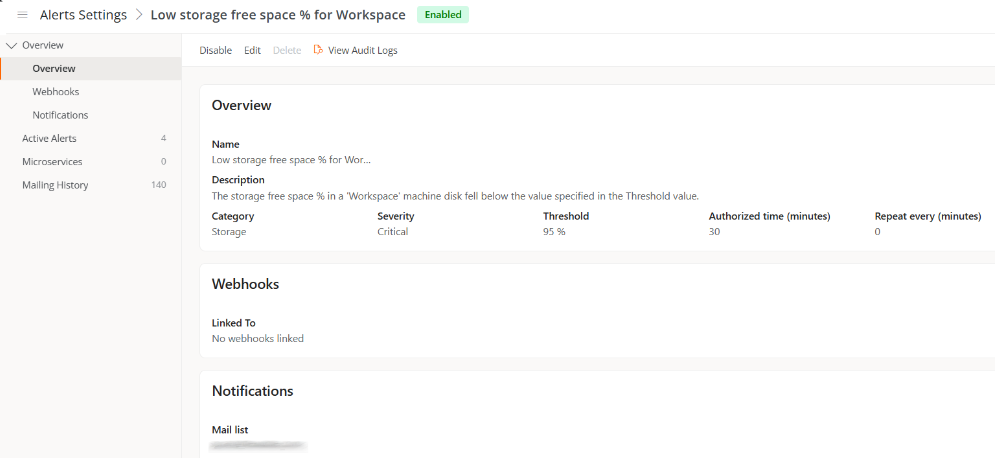
Also includes:
Webhooks
Displays the list of webhook integrations associated with the alert.
Notifications
Displays the list of email addresses for recipients who will be informed when the alert is activated.
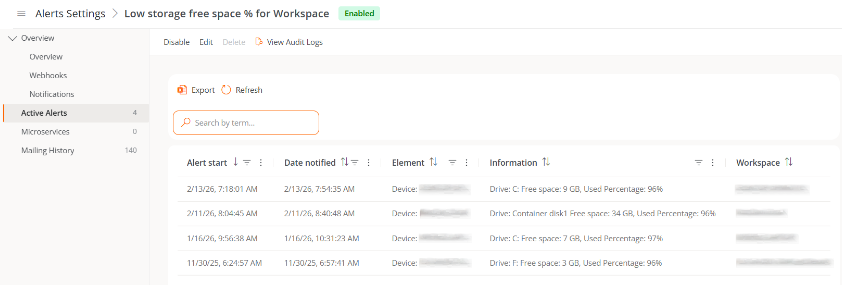
Active alerts
Lists the devices where the alert is currently active.
- Information. Description of the alert.
- Start Date. Date and time the alert is recorded.
- Notification Date. Date and time of the alert notification.
- Element. Type of device on which the alert is recorded.
- Workspace. Name of the device where the alert is registered.
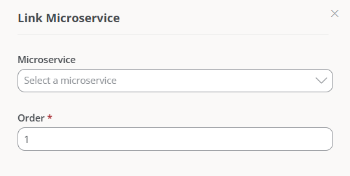
Microservices
Allows associating the alert to one or more microservices for automatic execution.
The Link button opens the association form, where the following is defined:
- Which microservice the alert is to be linked to.
- Execution order, useful when you want to link more than one microservice.
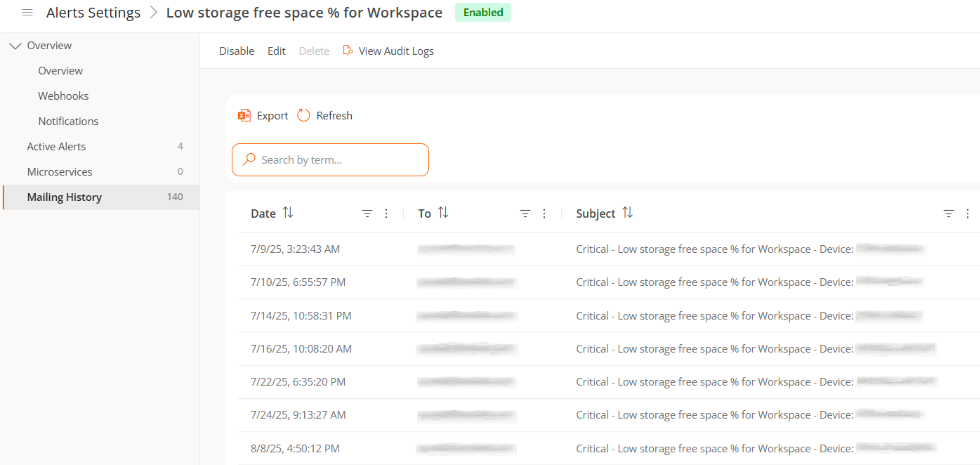
Send history
Shows the record of sent notifications:
- Date. Day and time the notification is sent.
- To. Email of the recipient.
- Subject. Name of the alert and the device where it was recorded.
- Error. State of the device that triggered the alert.
Actions from the detail view
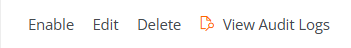
| Button | Action |
|---|---|
| Enable / Disable | Modifies the alert status. The alert will be enabled one minute after clicking the Enable button. The time is four minutes in the case of Disable. |
| Edit | Opens a form to modify existing settings. |
| Delete | Deletes the configuration of an alert. |
| View audit log | Allows access to the Audit section, to view the record of the current alert. |