Servers
Servers allows access to the list of servers in the environment. When FlexxAgent is installed on a device, it will by default appear in the Workspaces section. To move the device to the Servers view, select the device from the Workspaces section and execute the operation Machine Type->Server.
For more information, please review the documentation on Device Type.
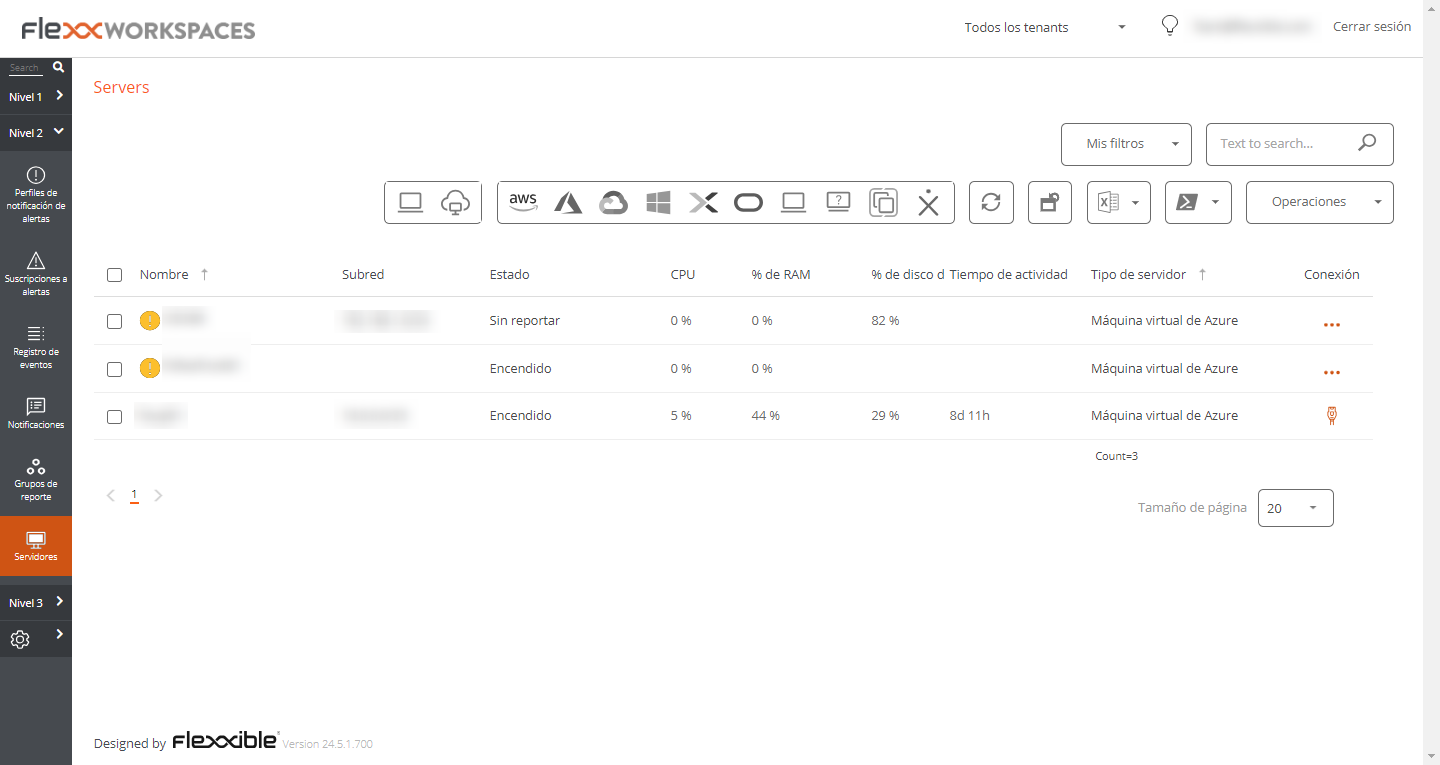
List view
The list view shows all servers configured on the platform. The menu options, located above the table, allow you to perform the same operations available for devices in the Workspaces section.
Available operations
The following are included:
Filtering options
This view allows the same filtering functionalities available in Workspaces.
Microservices
From the >- button it is possible to execute any of the microservices enabled for the organization that have System as the configured context. This allows the execution of microservices with administrative permissions on the devices.
The actions of enabling, creating, modifying, or deleting microservices are performed from the Portal.
Operations
The Operations button allows executing the same device management actions as the Workspaces view.
Detail view
The detailed view of a server contains the following sections:
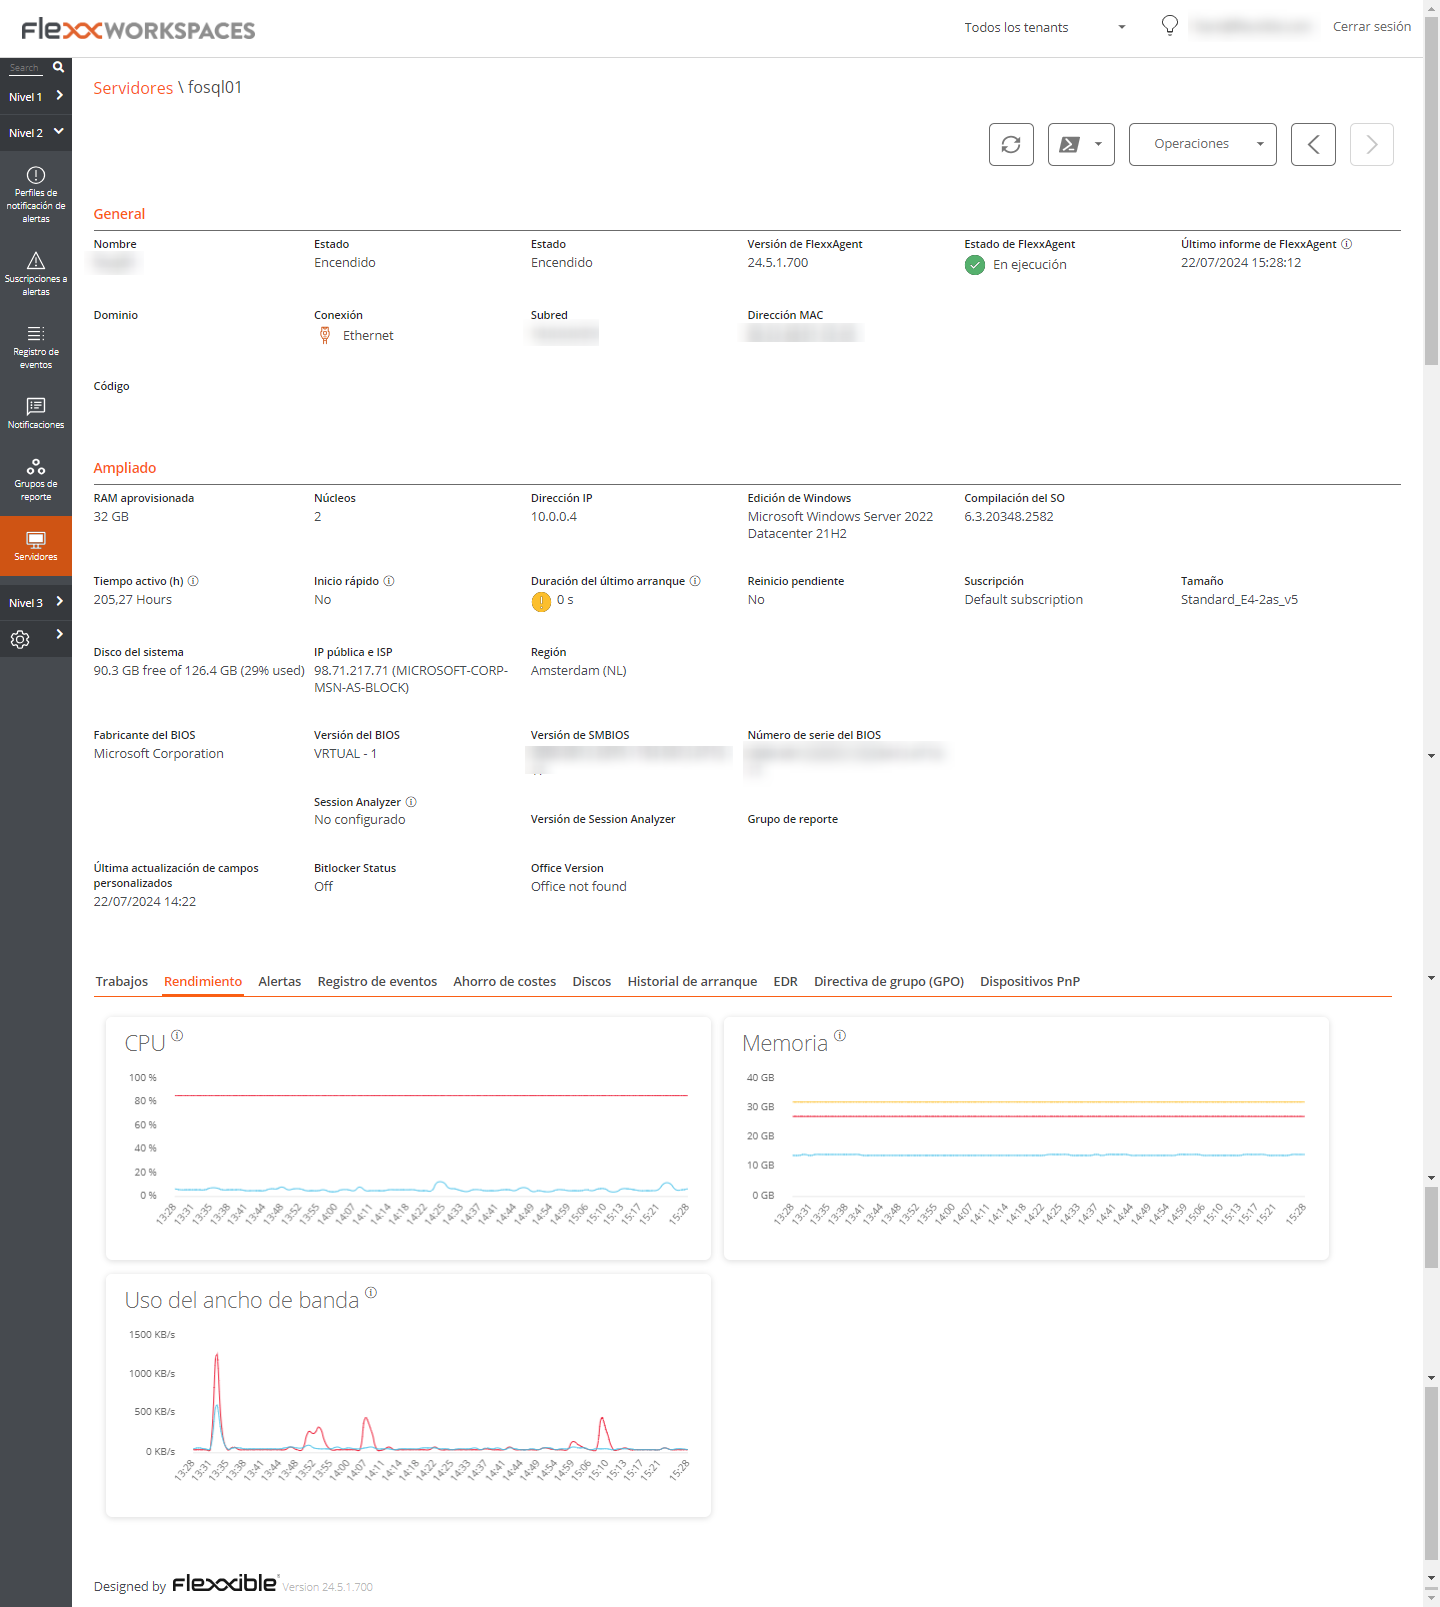
- General information
- Extended information
- Specific information segmented into tabs at the bottom
General
The general information block of the device contains:
- Name. Device hostname.
- Status. Power status (on-off).
- FlexxAgent Version FlexxClient version number.
- FlexxAgent Status. Execution status of FlexxAgent (Running or Stopped)
- Last FlexxAgent Report Date. Date of last report received from FlexxAgent on the device.
- Domain. Domain to which the device belongs.
- Connection Type. Type of connection used by the device (Ethernet or Wireless)
- Subnet. Network addressing.
- MAC Address. MAC identifier.
- Code. Allows a string to be set as a code.
- Network Changes. Indicates if the device has changed its network configuration recently.
- Tags. Allows associating identifying tags.
- OU. Organizational unit of the domain where the device account resides.
Extended
The extended information block of the device contains:
- RAM. Total amount of RAM.
- Cores. Number of processor cores.
- IP Address. IP Address of the device.
- Windows Edition. Operating system edition.
- OS Build. Operating system build number.
- Uptime. Duration the device has been running since the last start or restart; note that if fastboot is enabled, the device only turns off when restarted.
- Fastboot. Indicates if the server has fastboot enabled.
- Last Windows Update. Date of last patch application.
- Last Boot Duration. Duration of the boot of the last start.
- Pending Restart. Determines if the device has a pending restart to apply updates.
- System Disk. Indicates the used space of the system disk.
- Public IP and ISP. If public IP data collection is enabled, it shows the public IP and provider.
- Region. If it is an Azure virtual machine, it will display the Azure region of the host.
- BIOS Manufacturer. Manufacturer of the BIOS.
- BIOS Version. Current BIOS version.
- SMBIOS Version. Current SMBIOS version.
- BIOS Serial Number. Unique identifier of the BIOS.
- Session Analyzer. Indicates the status of the FlexxAgent Analyzer process:
- Not configured. FlexxAgent is configured not to start Session Analyzer.
- Disabled. FlexxAgent does not start Session Analyzer because it has been disabled via the 'AvoidLaunchAnalyzer' registry key.
- Configured. FlexxAgent is configured to start Session Analyzer in all user sessions.
- Installed. FlexxAgent will not attempt to start Session Analyzer because Session Analyzer is already installed on the device.
- Not compatible. FlexxAgent does not start Session Analyzer because it is not compatible with the device's operating system (e.g., a 32-bit version of Windows).
Tabs
The tabs at the bottom show grouped specific information. The following are included:
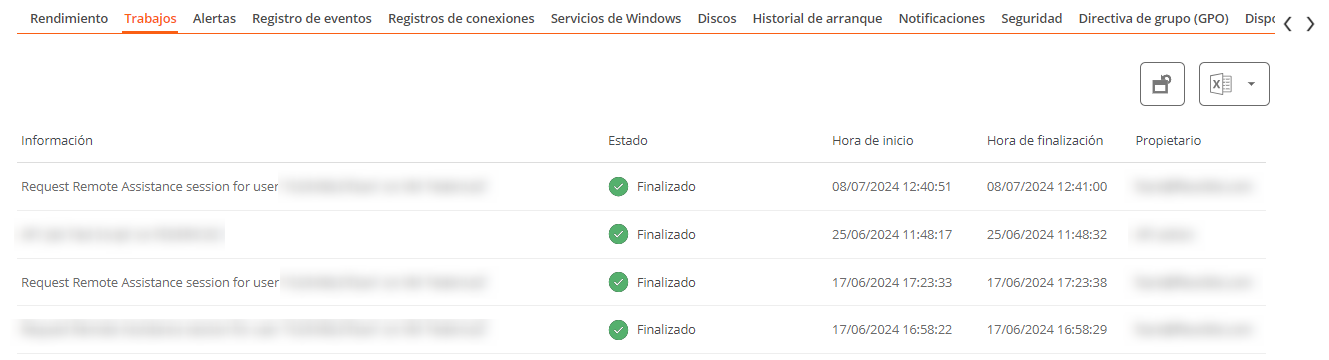
Job
All actions performed from servers on one or more devices are audited in the job queue. This tab allows you to check the jobs done for the active device, without needing to go to the corresponding section.
Performance
In the performance tab, graphical information about CPU, memory, and bandwidth usage is displayed.
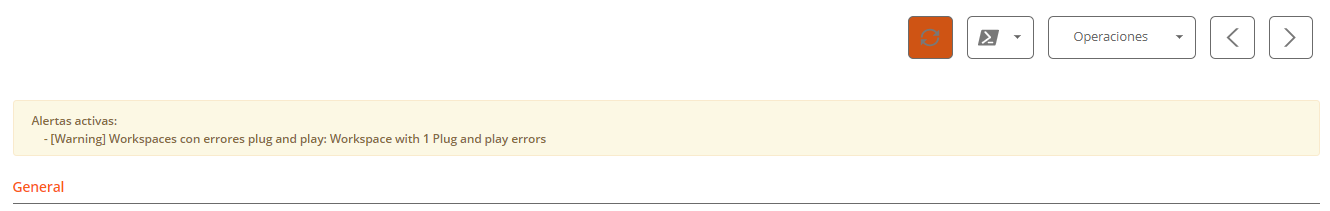
Alert
Presents a table with the list of all active alerts on the device. When an alert is logged, a notice is displayed at the top of the page.
Event Logs
Information about the events present on the device. By default, errors are filtered to show only those with Error or Critical severity level. FlexxAgent obtains this information in 10-minute intervals.
The available settings allow you to modify the sampling time or include events by their ID.
Disks
Displays a list of all partitions present on the disks identified in the system, as well as statistics of their capacity and occupancy levels.
Boot history
Presents a graph on the duration of the last ten boots of the device.
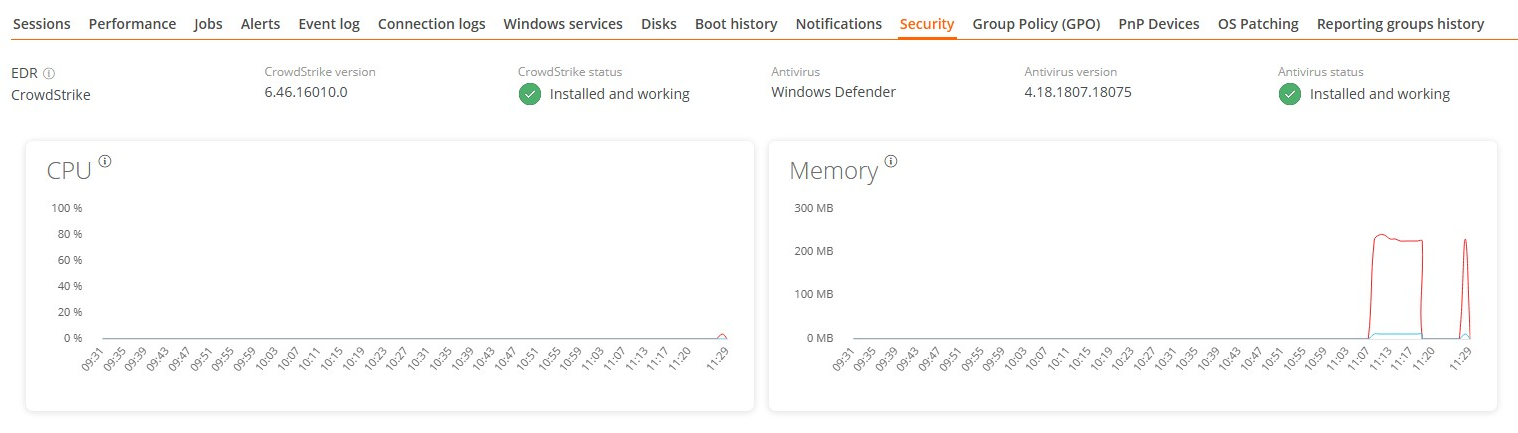
Security (EDR)
From this section, you can check the name of the antivirus installed on the device, as well as its version number, execution status, and a graph on its RAM and CPU usage. This same information will be shown if FlexxAgent detects CrowdStrike as Endpoint Detection and Response (EDR).
Group Policy (GPO)
Displays information about the group policies applied on the active device. Allows you to see the names of the policies as well as the verification time.
PnP Devices
Displays Plug and Play (PnP) devices that are in an error state, which may be due to hardware failures or incorrect driver or device configuration.
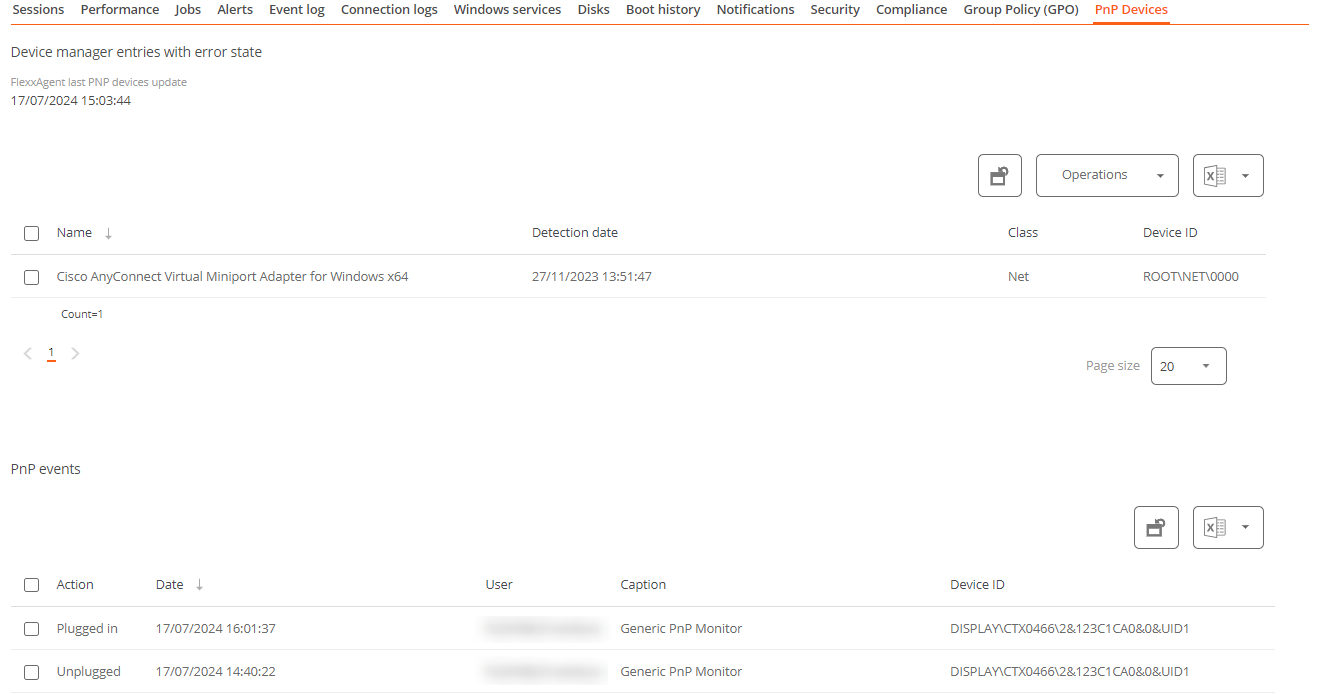
At the bottom of this view, a table shows all events related to PnP devices, creating an entry each time a peripheral is connected or disconnected.