Detail view
Clicking on the name of a device in the Workspaces list view opens the device details. The interface is structured into four sections:
Available actions
The detail view allows you to perform the same actions on the active device as in the list view, except for updating FlexxAgent, as well as other actions that are only available in this view.
Available actions:
- Microservices execution.
- Perform actions included in the
Operationsbutton.
Microservices execution
From the >- button, you can execute any microservice enabled for the organization that has System as configured context. This allows the execution of microservices with administrative permissions on the devices.
The actions of enabling, creating, modifying, or deleting microservices are performed from the Portal.
Operations
From the detail view of a device you can perform the same Operations as in the list view, as well as Edit, Session Analyzer log tracking and OS Patching.
Edit
This operation allows the user to assign an identification code to a device and/or a description.
The code allows associating the device with an inventory item. To edit it, click on Operations -> Edit -> Code.
The Description field allows adding free text as a description or notes to the device.
When the code and/or description are defined, they will be visible in the general information block of the device, and it will be possible to filter by these fields in the list views.
Session Analyzer trace logging
FlexxAgent Analyzer logs can be configured to include or exclude information by criticality levels. From Operations -> Session Analyzer trace logging you can manage the log level change for FlexxAgent Analyzer.
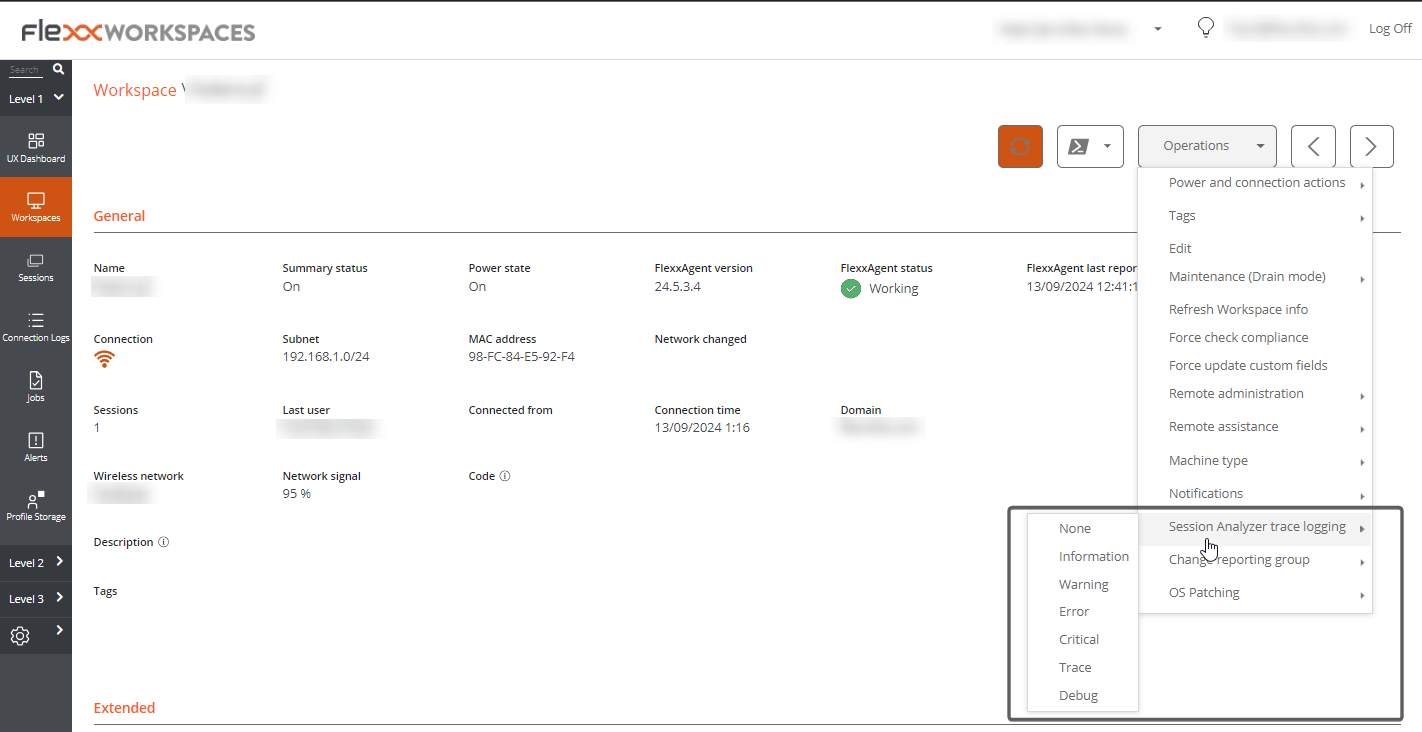
These logs are stored in the directory %LOCALAPPDATA%\FAAgent\Logs.
Operating system update
This option allows managing the update of the device that uses Windows as the operating system.
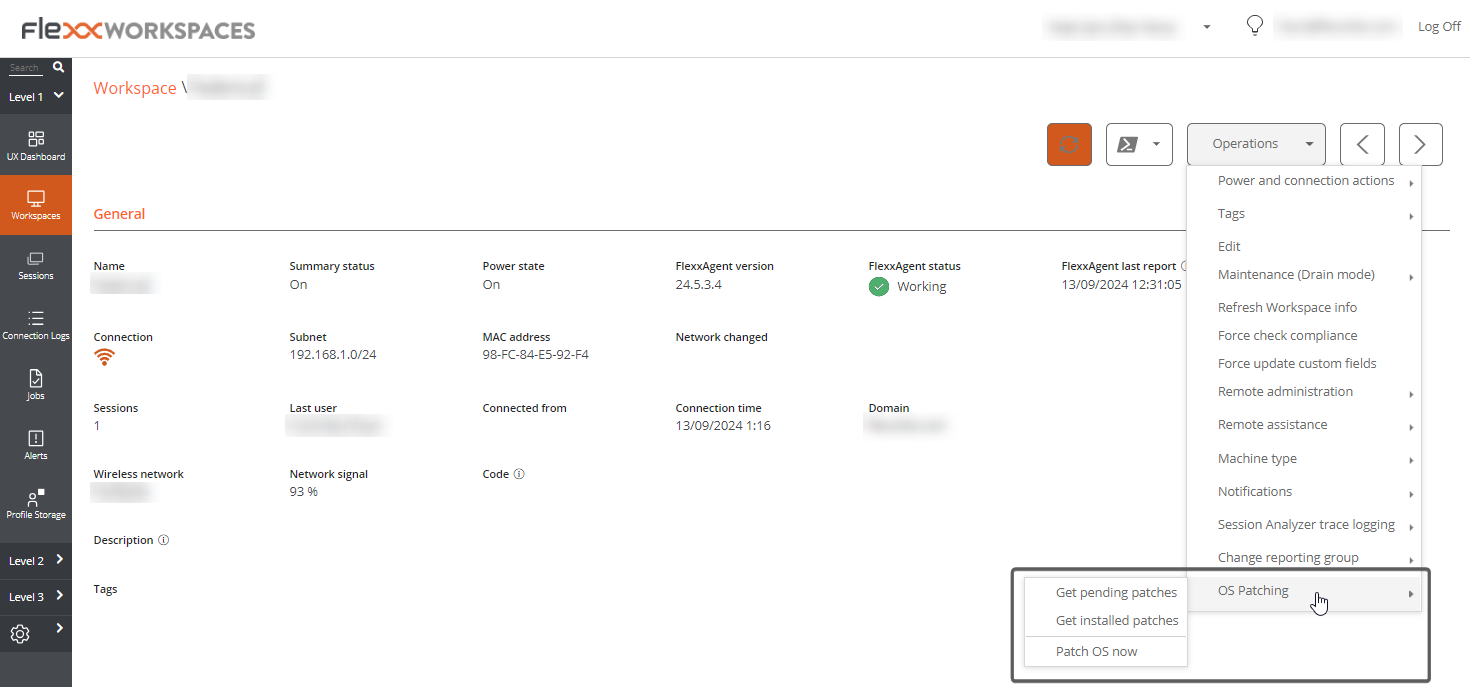
Available options:
- Get pending patches. Retrieves the patches available for installation on the device, in list format.
- Get installed patches. Retrieves the patches installed on the device, in list format.
- Patch now. Installs pending patches on the device.
For all patches, Id, Installation/publication date, Severity, and the Title or name of the package are obtained.
Information obtained from the device
The general, detailed, and tabbed information collected by FlexxAgent varies according to the device's operating system type: