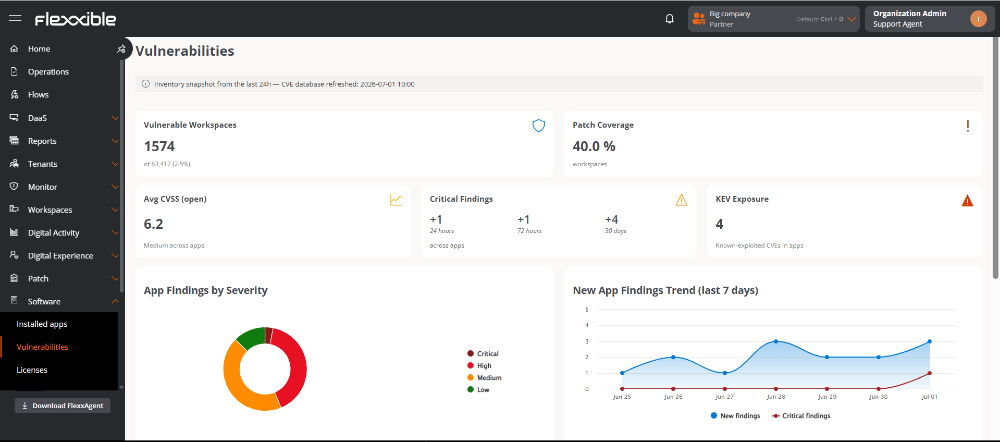
Vulnerable workspaces
Shows the number of devices that have at least one open vulnerability, along with the percentage they represent relative to the total number of inventoried devices. This indicator helps evaluate the extent of exposure in the environment, although the actual impact will also depend on the criticality of the affected devices.Patching coverage
Indicates the percentage of vulnerable components for which a patch is available and already applied, relative to the total number of vulnerable components detected.Average open CVSS
Shows the average CVSS (Common Vulnerability Scoring System) score, on a scale of 0 to 10, of all open vulnerabilities detected. Although this value provides a reference for the average risk level, it should be interpreted together with the number of critical findings and KEV vulnerabilities.Critical findings
Shows the number of open vulnerabilities classified with Critical severity. The variation indicated over the last 24 hours reflects the number of new critical findings detected during the last update cycle.
KEV exposure (Known Exploited Vulnerabilities)
Indicates the number of open vulnerabilities included in the Known Exploited Vulnerabilities (KEV) catalog, which compiles those for which there is evidence of active exploitation. These vulnerabilities are identified through their corresponding CVE (Common Vulnerabilities and Exposures).Application findings by severity
The chart represents the distribution of open vulnerabilities by their severity level.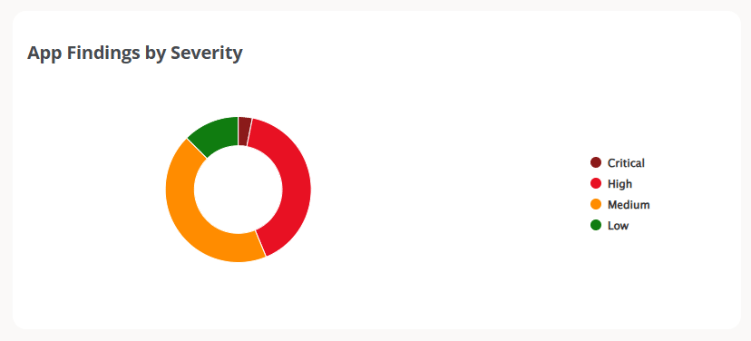
Severity levels
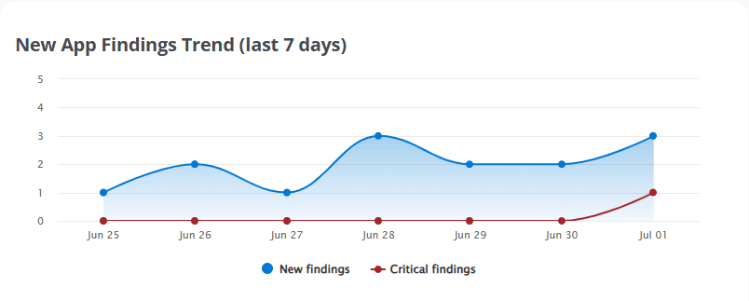
Evolution of new application findings (last 7 days)
The chart shows the daily evolution of the vulnerabilities detected in applications over the last seven days.- New findings (blue). Number of new vulnerabilities detected each day.
- Critical findings (red). Number of new critical vulnerabilities detected each day.
Top vulnerable applications
Shows the five installed applications that concentrate the highest number of open vulnerabilities. Each entry includes the name and version of the application, the vendor, the number of open CVEs, and the existence of associated KEV vulnerabilities.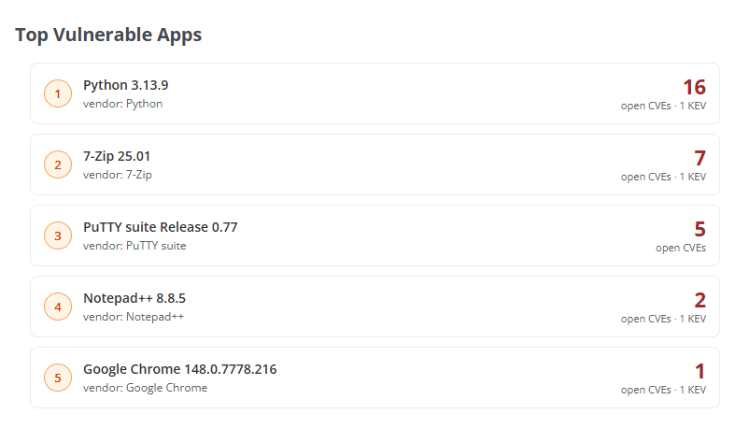
Details of open CVEs in applications
When you select an application, the detail of its open vulnerabilities is displayed.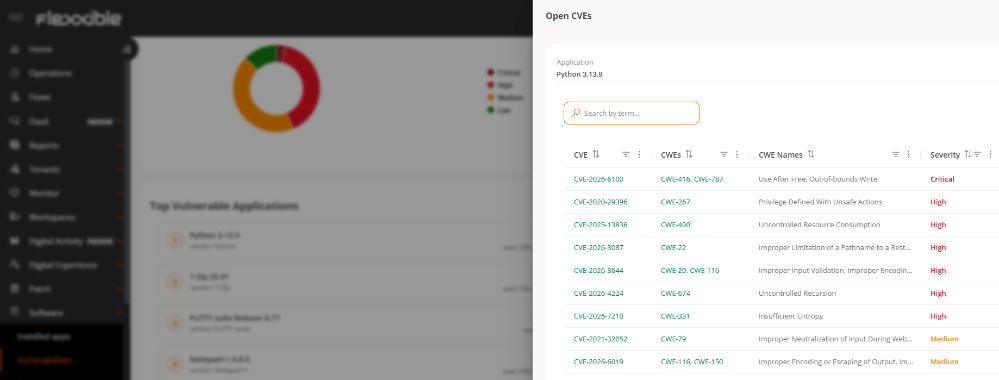
- CVE. Unique identifier of the vulnerability. Clickable. Provides access to the corresponding page for that vulnerability in the official National Vulnerability Database (NVD).
- CWE. Identifier of the associated software weakness.
- CWE names. Description of the identified weakness.
- Severity. Severity level assigned to the vulnerability.
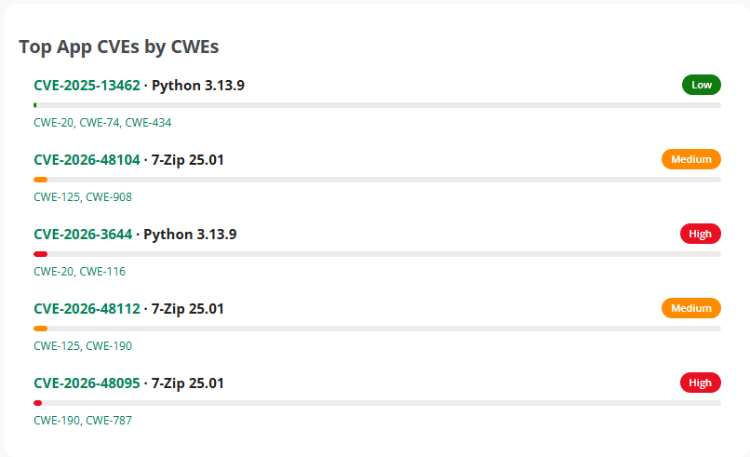
Top CVEs by CWE (Common Weakness Enumeration) in applications
This panel groups the vulnerabilities detected in applications based on the number of software weaknesses (CWE) they are related to. Each record shows the CVE identifier, the affected application, the associated CWEs, and their severity level.