

Charts
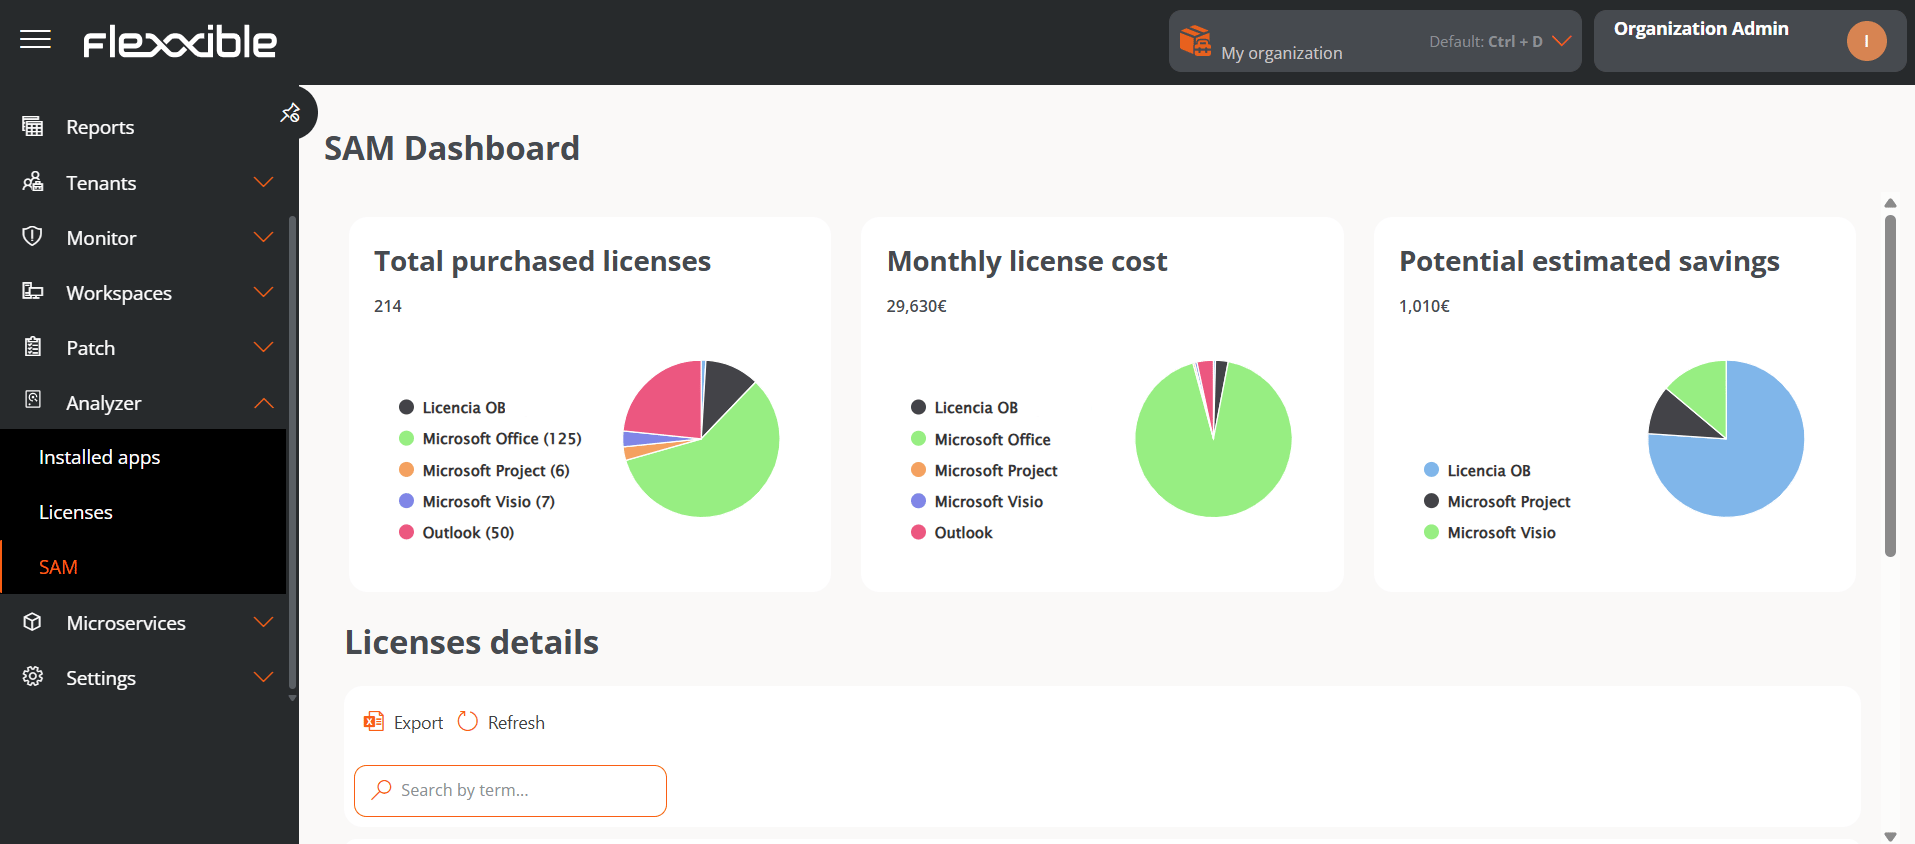
This view is made up of three charts that provide data on usage, cost, and potential savings that could be applied to the use of the configured licenses.Information about licenses is calculated in real time. A license’s usage starts to be recorded from the moment it is created and the installed applications are associated with it.
- Total licenses purchased. Number of licenses purchased. The data can be segmented by license.
- Total cost per month. In euros, total amount consumed per month. The data can be segmented by license.
- Potential savings. In euros, details of the licenses that are not in use and that may be subject to non-renewal to optimize costs. The data can be segmented by license.
License details
This table contains the following information:- License name
- License type
- Total licenses purchased
- Active licenses
- Inactive licenses
- License utilization rate
- Cost per license
- Projected savings
- Currency
The Active licenses, Inactive licenses, and License utilization rate fields always show the data corresponding to the month prior to the current one. This lets you calculate these indicators using complete periods and prevents the current month’s values from being partial.
- The license’s total monthly cost
- The potential savings that can be applied to the license, based on the usage it had in previous periods.
- The total number of licenses purchased, segmented by licenses in use and inactive licenses.