User experience
In an organization, user experience measures how employees interact with the digital ecosystem of their organization. This includes evaluating the performance of the hardware and software they use in their workday, as well as their emotional perception.
Basic concepts
Analyzer builds the UXI (user experience indicator) based on the weighting of two others:
- Workspace Reliability Index (WRI)
- User sentiment
Workspace Reliability Index (WRI)
The Workspace Reliability Index, or device reliability indicator, allows for an objective performance score for a device based on the collection and analysis of detected issues. Multiple indicators are considered which, if certain issues arise in devices, reduce the score from an initial 5-star rating. These metrics include:
| Indicator | Severity | Threshold | Recurrence | |
|---|---|---|---|---|
| HIGH_CPU | MEDIUM | Above 80% for more than 5 minutes | 5 min | |
| HIGH_RAM | MEDIUM | Above 80% for more than 5 minutes | 5 min | |
| BSOD | HIGH | Presence of a BSOD (blue screen) | Once per day | |
| APP_CRASHES | HIGH | Presence of application crashes | Once per day | |
| APP_HANGS | HIGH | Application crashes presence | Once per day | |
| TEAMS_PROBLEMS | HIGH | Detected problems in Microsoft Teams | Once per day | |
| PNP_ERRORS | HIGH | Detected peripheral errors | 5 min | |
| WIFI_SIGNAL | HIGH | Signal below 40% for 10 minutes | 5 min | |
| LOGIN_DURATION | HIGH | More than 60 seconds | Once per day | |
| UPTIME | LOW | More than 15 days | Once per day | |
| RESTART_PENDING | LOW | More than one day | Once per day | |
| CRITICAL_EVENTLOG | HIGH | Presence of critical events in the event viewer | Once per day | |
| UID | MEDIUM | High system response rate (greater than 350 ms) | 5 min | |
| LOW_STORAGE | MEDIUM | 500 MB | Once per day | |
| MULTIPLE_EVENTLOGS_ERRORS | MEDIUM | More than 50 errors generated in the event log in the last hour | Once per day | |
| UNAVAILABLE | MEDIUM | Session unavailable for more than 5 minutes | 5 min | |
| RAM_UNDER_MINIMUM | MEDIUM | Less than 1 GB of free memory for 120 minutes | 5 min | |
| WINDOWS_UPDATES_POOLED | MEDIUM | Windows Update service running on pooled machine | 5 min | |
| BOOT_DURATION | HIGH | Boot duration longer than 90 seconds | Once per day |
Where each severity deducts the following score from the initial 5-star rating.
| Severity | Penalty |
|---|---|
| HIGH | 0.2 |
| MEDIUM | 0.016 |
| LOW | 0.008 |
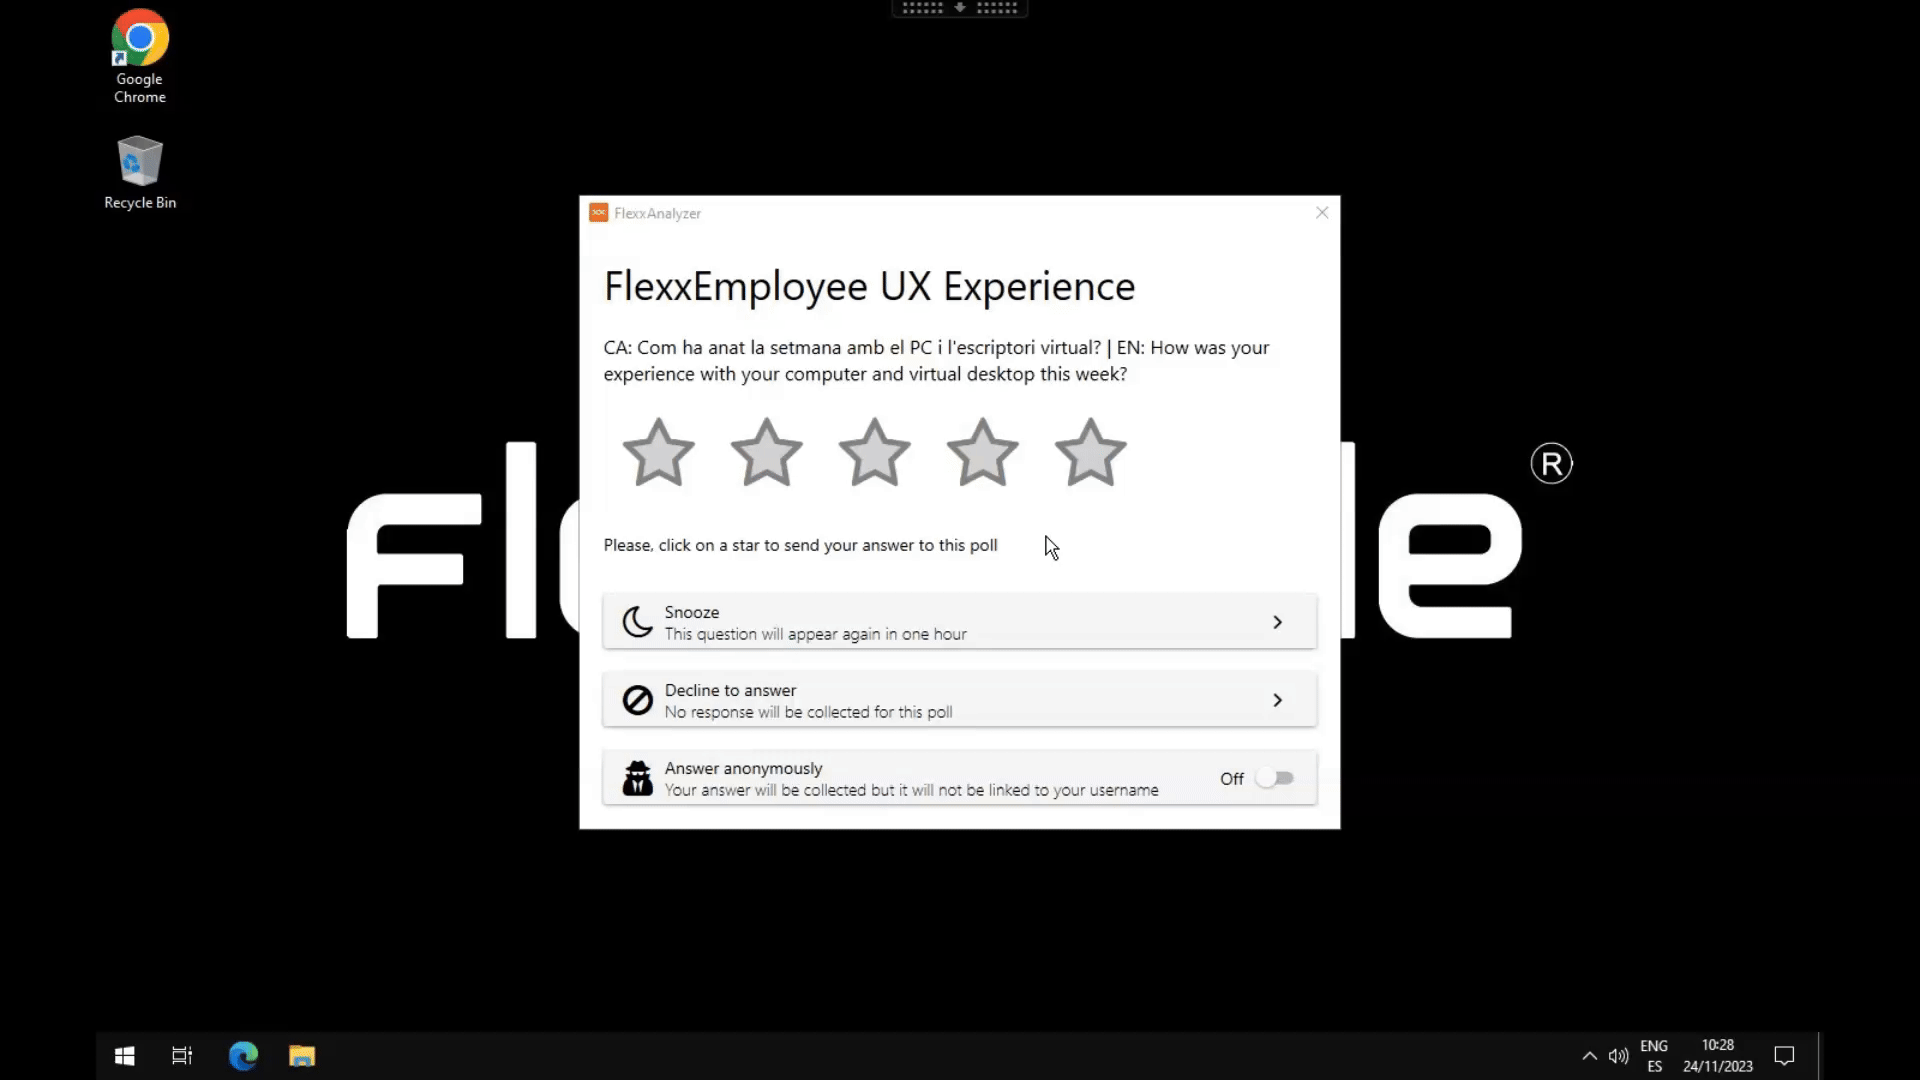
User surveys
User sentiment is captured through surveys. And the way to respond is by providing a satisfaction rating based on a score between 0 and 5 stars.
Web Interface
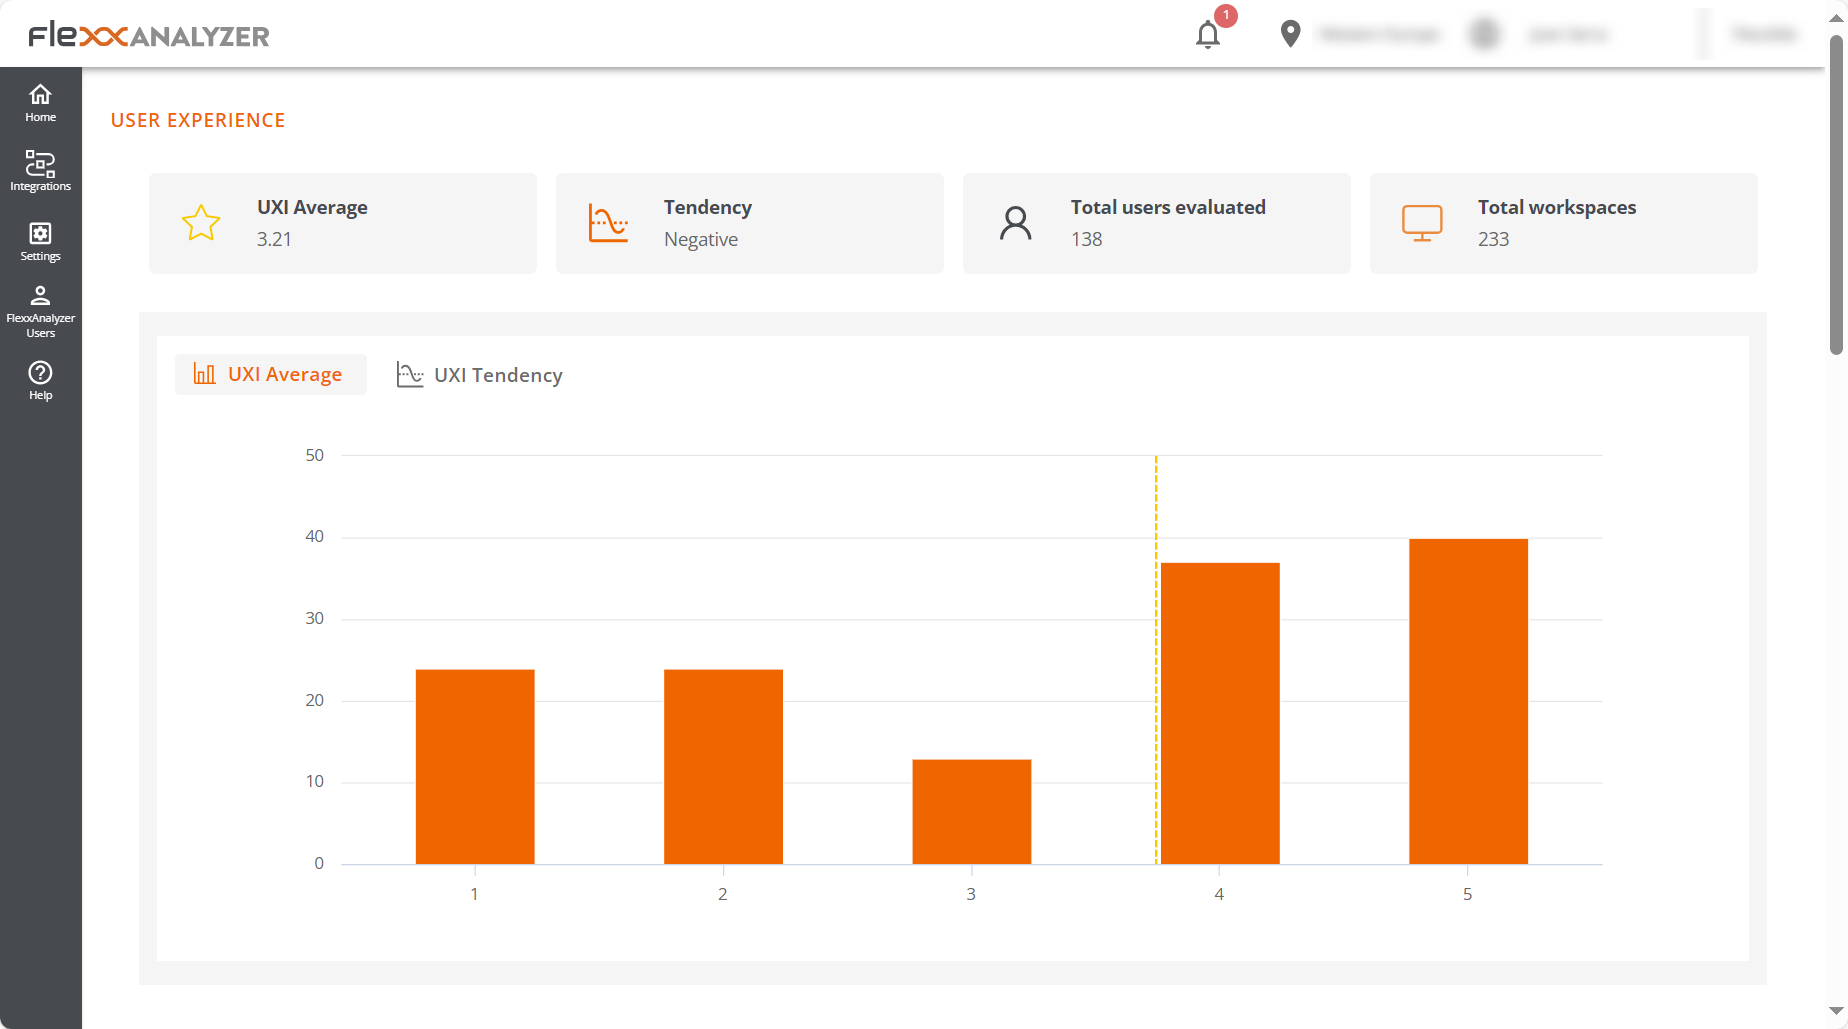
The dashboard view of the 'User Experience' section consists of the average information of all devices and users in the organization; it is calculated daily.
Global view
The global numbers are offered at the top.
- UXI Average. Indicator of average experience for the entire organization. It can range from 0 to 5.
- Tendency. Indicator that based on the evolution of the UXI average shows whether the tendency is positive or negative.
- Total users evaluated. Total number of users evaluated.
- Total workspaces. Total number of devices evaluated.
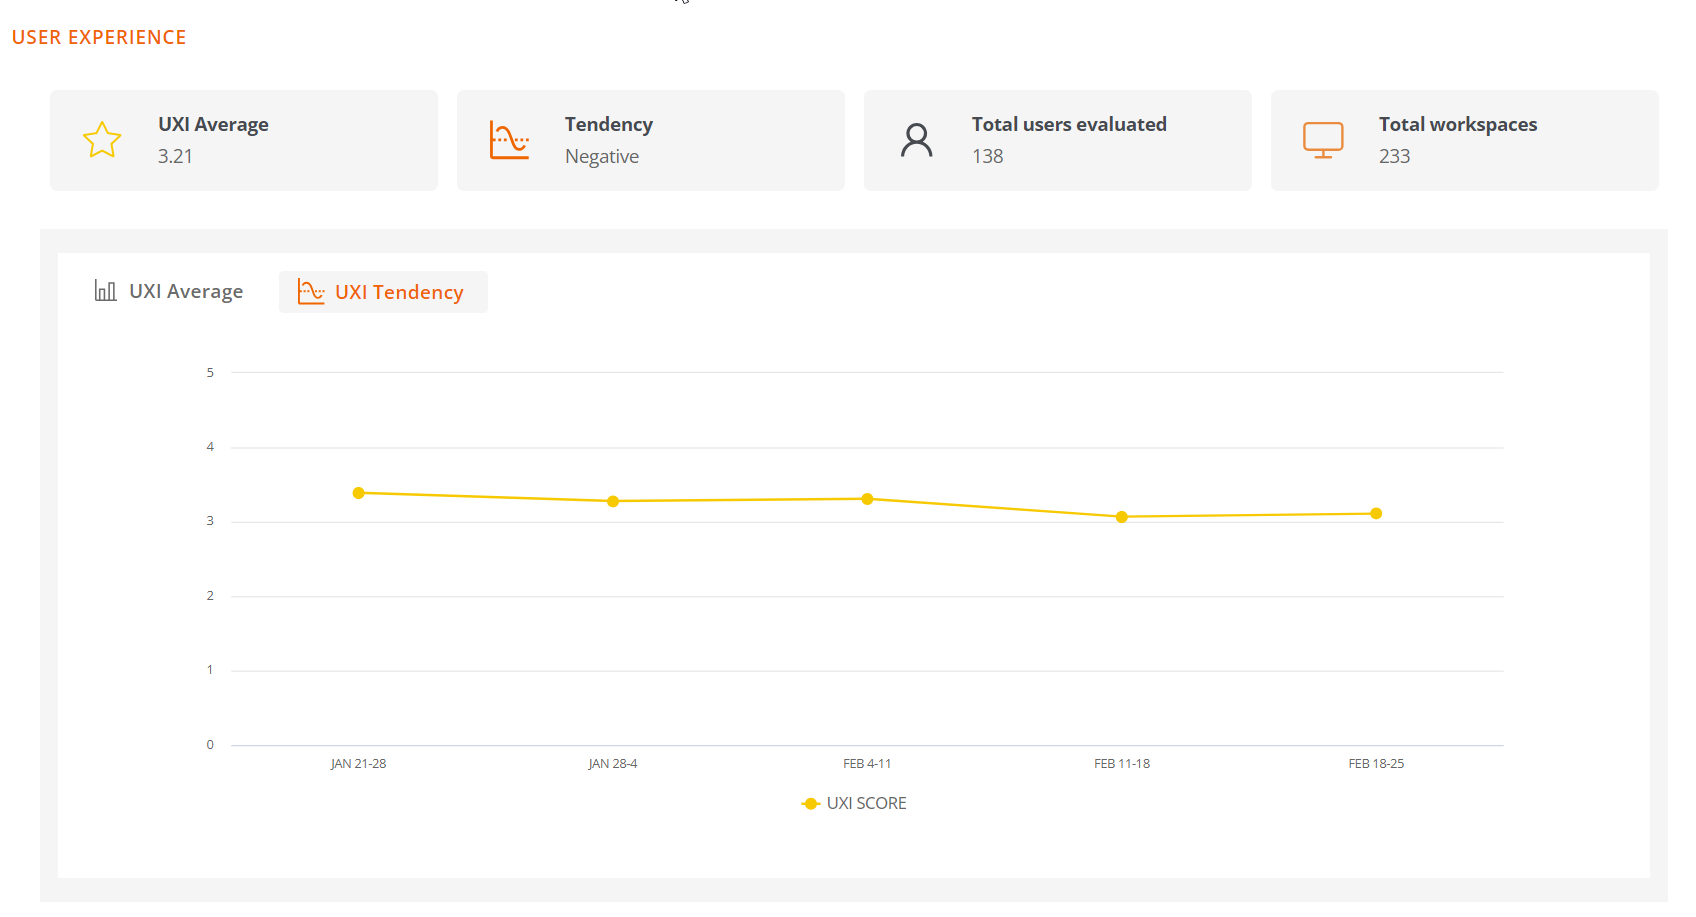
Two charts are also included:
- UXI Average. Shows the distribution of users by UXI level, along with the organizational average.
- UXI Tendency. Shows the temporal evolution of the UXI for the last month.
At the bottom of the screen, by clicking on a user, individual cases can be evaluated. You can also see tables containing information about users who require attention due to sudden variations of this indicator or a very low score.
Individual view
This view provides the user data under analysis, including:
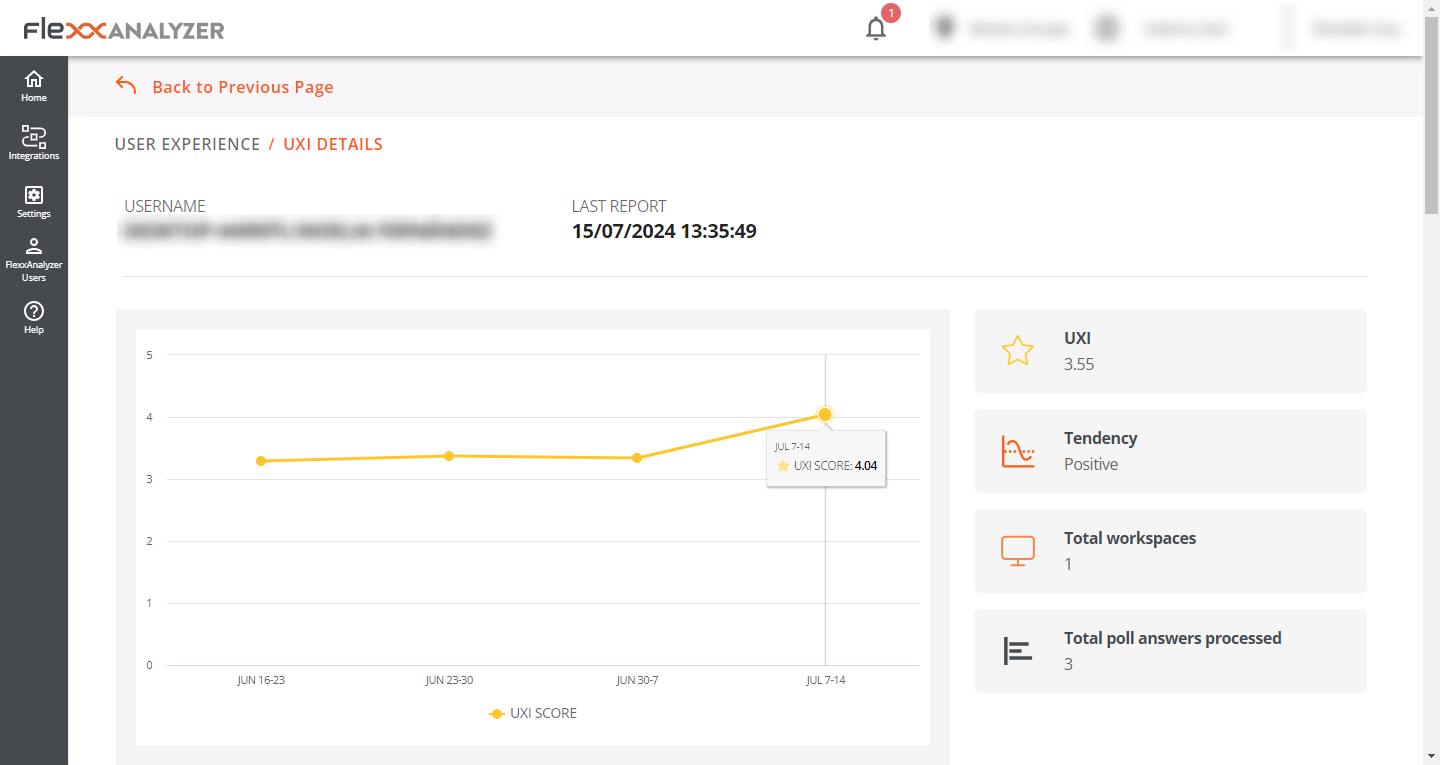
- Username. Username reported in the user's session.
- Last report. Date of the last report received for this user.
- UXI Average. Experience indicator for the user; can range between 0 and 5.
- Tendency. Indicator that, based on the evolution of the user's UXI average, shows whether the user's trend is positive or negative.
- Total workspaces. Number of devices the user has worked on.
- Total poll answers processed. Number of surveys the user has responded to and are considered in this evaluation.
At the bottom of the screen, detailed information is included in a table format.
- Polls in the last 30 days. Surveys answered by the user in the last 30 days. The detail of this view offers the user's survey scores compared to the organization's average for the same period.
- Workspaces in the last 30 days. Provides a table containing all devices the user worked on in the last 30 days, as well as the number of times worked on each, the operating system, and the WRI indicator for each.
- Issues in the last 30 days. Shows the list of problems detected on the devices used by the user in the last 30 days, along with the date and score each had.