Table information
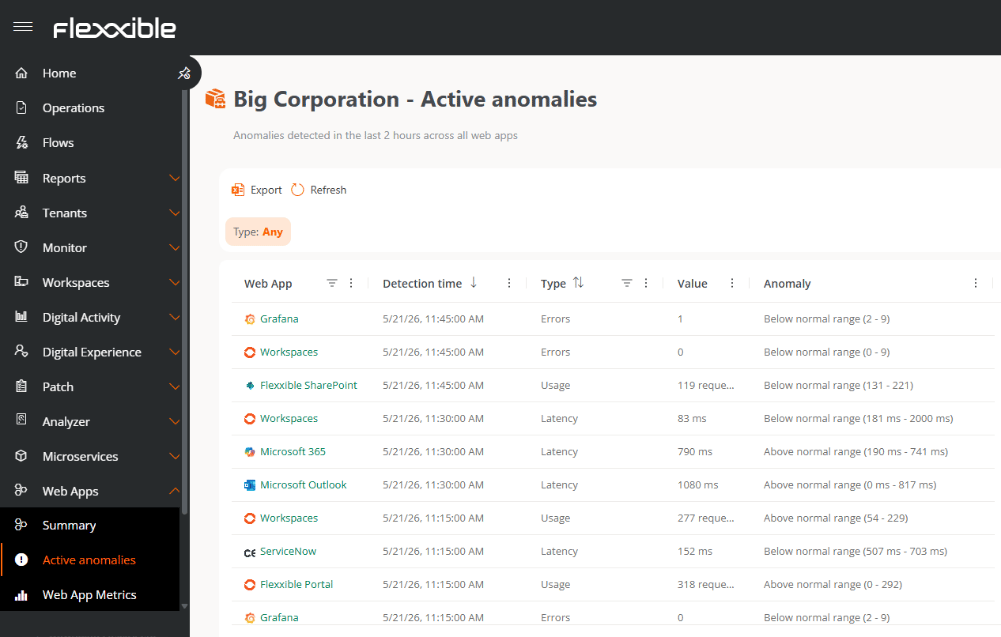
The table includes the following fields:- Web App. Name of the web application where the anomaly was detected.
- Detection time. Exact date and time the anomaly was identified.
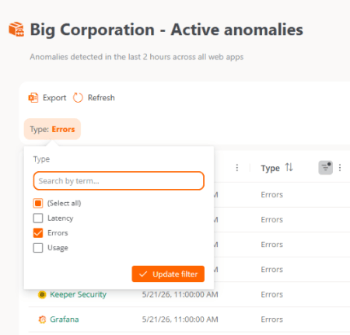
- Type. Category of the detected anomaly: Latency, Error, or Usage.
- Value. Value associated with the detected anomaly, such as:
- Response time in microseconds
- Number of requests
- Number of errors recorded
- Anomaly. Specifies whether the detected behavior is above or below the usual range.