Detail view
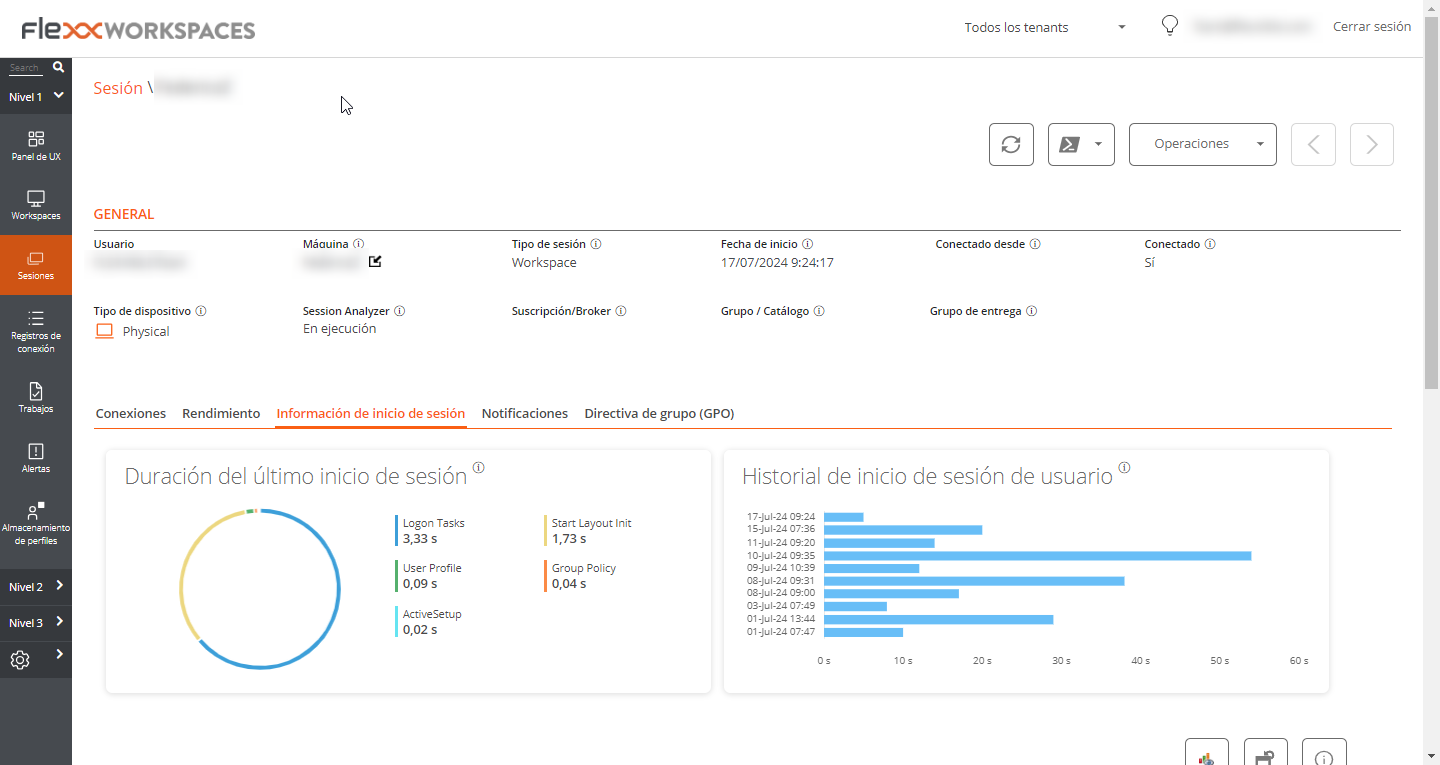
Clicking on a record from the session list provides access to the details of the selected session. The interface is structured into three sections:
- Available actions at the top
- General information
- Specific information segmented into tabs at the bottom

Available actions
From the device detail view, it’s possible to perform the same actions as in the list view for the active device. This includes:
- Microservices execution.
- The actions included in the
Operationsbutton.
Microservices execution
Using the >- button, you can run any of the microservices enabled for the organization that have Session as the configured context. This allows the execution of microservices under the user's identity.
The actions of enabling, creating, modifying, or deleting microservices are performed from the Portal.
Operations
From the Operations button, you can execute the actions detailed in Available Operations for the active device.
General
The general information block of the device contains:
- User. Session user in domain\user format.
- Machine. Device hostname.
- Session Type. Session type, which can be Workspace or application for virtualized application sessions.
- Start Date. Date and time of session establishment.
- Connected From. When the selected device is a VDI or similar, it displays the name of the endpoint from which the virtual device is accessed.
- Connected. Indicates whether the user is actively connected to the session or if they have disconnected from it.
- Device Type. Virtual or physical.
- Session Analyzer. Indicates whether the FlexxAgent session analysis process is active or inactive.
- Subscription/Broker. If used, the Microsoft Azure or Citrix service that manages user connections to the workspace (e.g., Microsoft Azure Virtual Desktop (AVD), Citrix DaaS, Citrix On-premises).
- Group/Catalog. If used, a collection of machines that defines the specifications of the devices and how they are provisioned to users. e.g. host pools in Azure Virtual Desktop or machine catalogs in Citrix).
- Delivery Group. If used, a collection of machines selected from one or more machine catalogs. It specifies which users can use those machines, plus the applications and desktops available to those users.
Tabs
The tabs at the bottom show specific grouped information, including the following:
Connections
 This tab contains information about the device's connections, i.e., each time a user starts or reconnects a disconnected session.
The session end date is only reported for disconnected or closed sessions; while the session remains active, the session end date will remain empty.
Performance
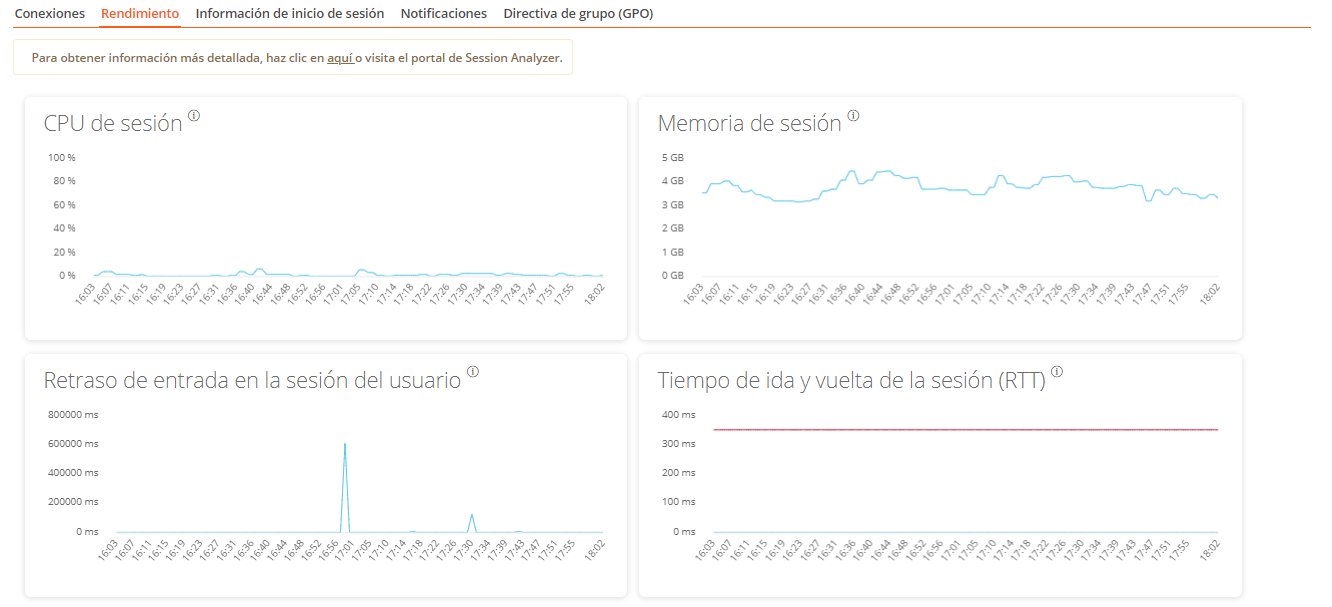
This tab groups graphs of the main performance counters for the last two hours.
 Graphs are included for:
- CPU. Percentage of processor usage for the session, excluding resources used by other sessions or system processes.
- Memory. Amount of memory used, excluding resources used by other sessions or system processes.
- User Session Input Lag. The user's input lag refers to the time span between when a user performs an action, such as clicking a mouse button or pressing a key, and when the corresponding response is displayed on the screen or executed.
- Session Round-Trip Time (RTT). Time it takes for a data packet to travel from the user's device to a server or remote destination and then back to the user.
At the top of the tab, a link allows direct access to the diagnostic view for the active session in Analyzer.
Login information
This tab allows you to see detailed information about the user's login times. The view consists of two graphs:
- Duration of last login
- User login history
At the bottom, a table presents the details for each user login.
Notifications
Allows you to see if the session has any active notifications and their configuration data. When there are active notifications, a warning is shown at the top of the page.
Group Policy (GPO)
This tab shows the information of group policies applied in the active session. It shows the name of the applied policy both at the user level and device level.
