To access this feature, you must have FlexxAgent version 25.12 or later installed.
Table information
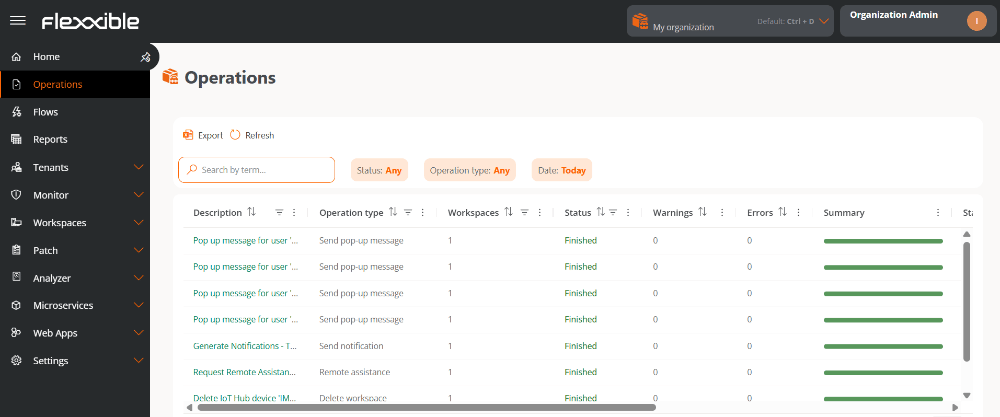
Each record in the table represents an operation and includes the following fields:- Description. Brief explanation of the operation performed.
- Workspaces. Number of devices on which the operation was run.
- Operation type. Type of operation run.
- Status. Current status of the operation.
- Warnings. Number of warnings recorded during execution.
- Errors. Number of errors detected.
- Summary. Visual indicator of the overall result of the operation.
- Started by. User who ran the operation.
- Started on. Date and time the execution started.
- Finished on. Date and time the execution finished.
- Created on. Date and time the operation record was created.
- Flow. Name of the flow associated with the operation, if applicable.
- Microservice. Name of the microservice associated with the operation, if applicable.
- FRA start. Start date and time of Flexxible Remote Assistance (FRA), if applicable.
- FRA end. End date and time of Flexxible Remote Assistance (FRA), if applicable.
- FRA type. Type of Flexxible Remote Assistance (FRA) executed: Attended, Unattended, or Dynamic.
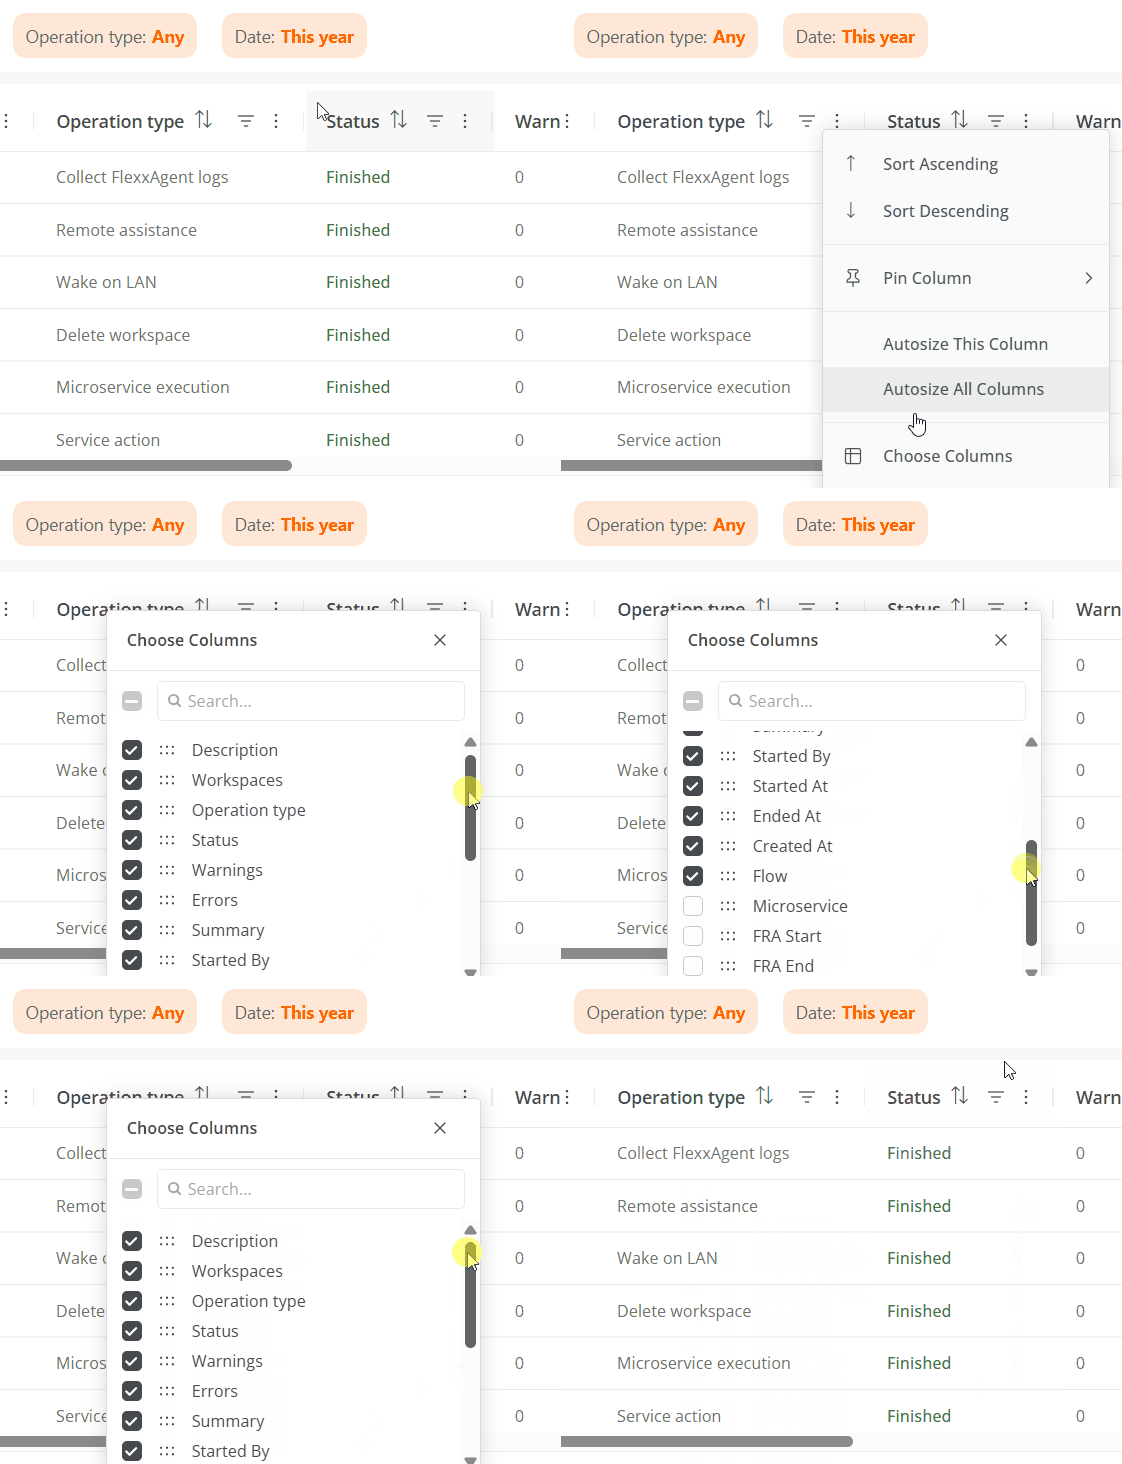
Execution statuses
The operation statuses are detailed below:Available filters
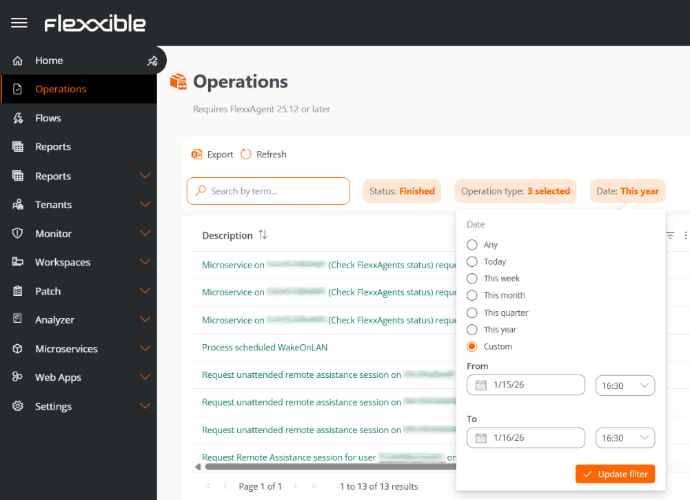
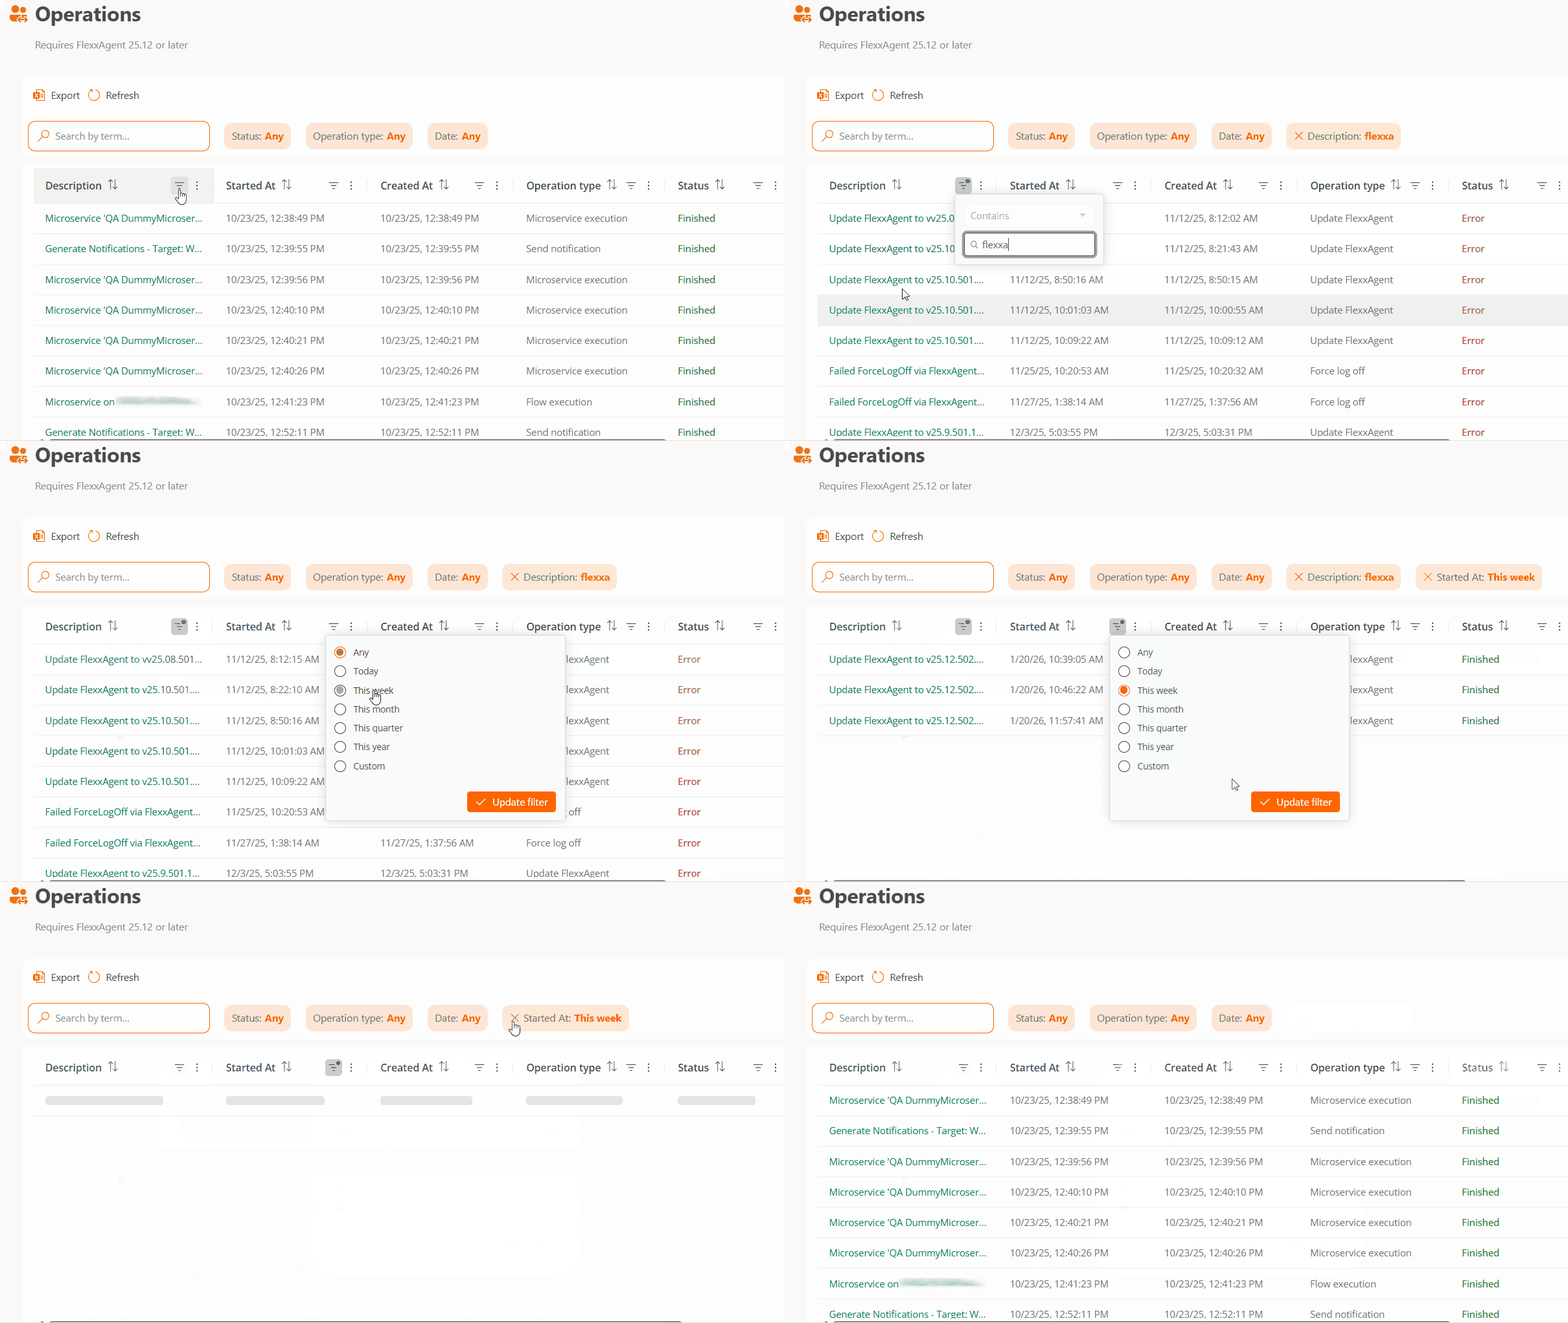
The operations table includes filters that make it easier to locate and analyze specific operations:- Status. Lets you filter by one or several execution statuses.
- Operation type. Lets you filter by the different types of operations available.
- Date. Lets you select predefined ranges (Today, This week, This month, This quarter, This year) or a Custom range. The selected period is applied simultaneously to the Started on, Finished on, and Created on fields.
Operation details
Selecting an operation from the table opens its details view, organized into the following tabs:- Details
- Workspaces
- Events
- Wake on LAN summary
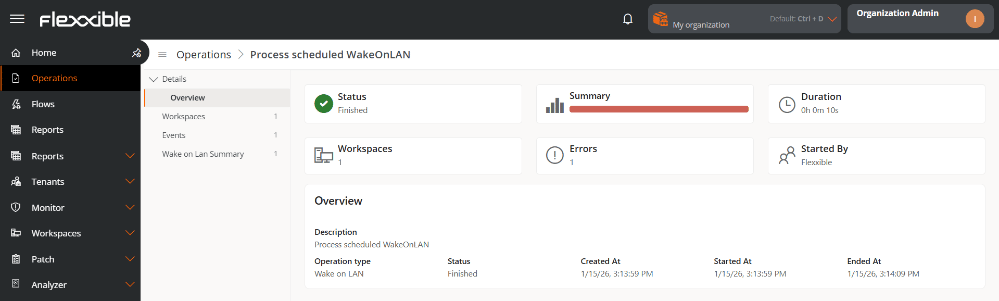
Details
This tab shows summary cards with the main indicators for the operation.
- Description
- Operation type
- Status
- Created on
- Started on
- Finished on

Remote assistance (Flexxible Remote Assistance)
When the operation corresponds to a Flexxible Remote Assistance session, a specific section is enabled with the following information:
- Type. Indicates whether the assistance is attended, unattended, or dynamic.
- Started on. Date and time the assistance started.
- Ended on. Date and time the assistance ended.
- Duration. Total session time.
Workspaces
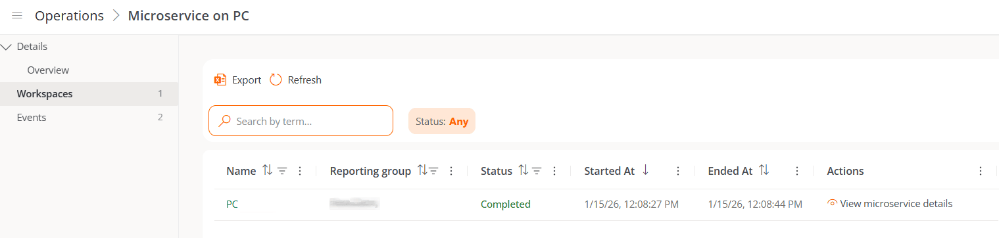
This tab shows a table with the list of devices on which the operation was run.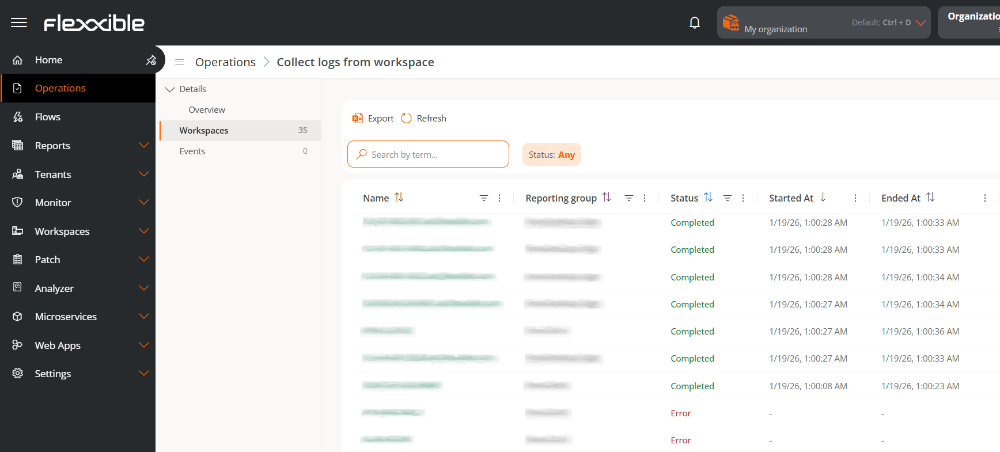
- Name. Device identifier. Clicking on it opens its details view.
- Reporting group. Reporting group the device belongs to.
- Status. Status of the operation’s execution on that device.
- Started on. Date and time the execution started.
- Finished on. Date and time the execution finished.
- Actions. Provides access to the execution details in operations of type Flows, Microservice execution, and End-user microservice.
Events
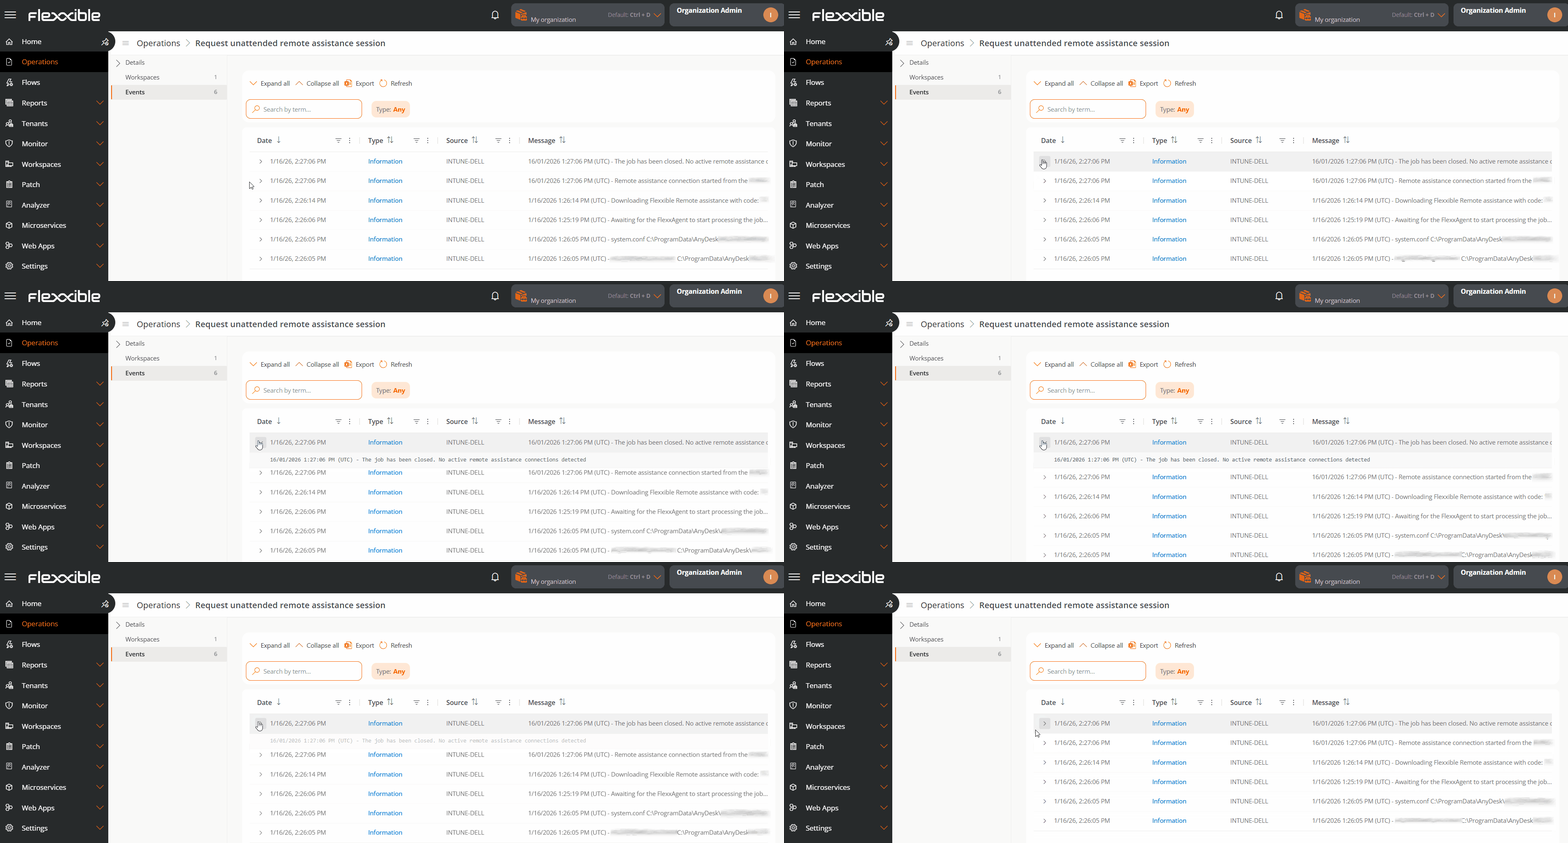
This section shows the history of events generated by the system during the operation’s execution, which lets you diagnose errors or verify progress. Each event includes:- Date. Date and time the event was recorded.
- Type. Event level: Information, Error, or Critical.
- Source. System component that generated the event.
- Message. Detailed description of the event.
Wake on LAN summary
This tab provides a comprehensive view of Wake on LAN operations, letting you centrally monitor the status and result of automatic device power-ons. This view is especially useful in operations involving a large number of devices, as it significantly reduces diagnosis time.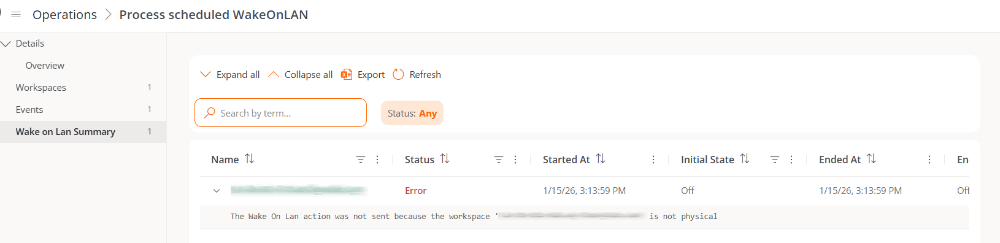
- Name. Name of the device that was attempted to be powered on.
- Status. Status of the power-on operation.
- Started on. Date and time the operation started.
- Initial state. Power state of the device when the operation started.
- Finished on. Date and time it finished.
- End state. Power state of the device when the operation finished.
- MAC address. Unique physical identifier of the device’s network card.
- Subnet. Network range the device belongs to.
Microservice execution details
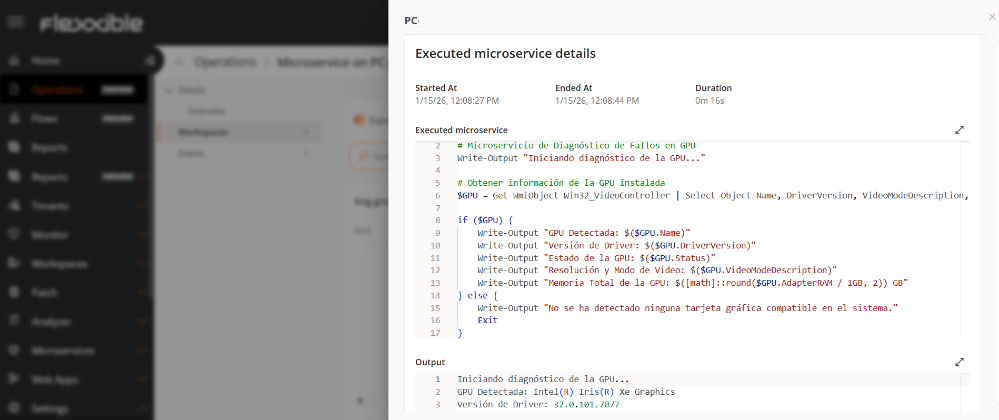
In operations of type Flows, Microservice execution, and End-user microservice, you can view detailed information about the microservice’s execution on each device. This view expands the information available in the Workspaces tab and lets you monitor the execution’s status, duration, and result, making it easier to analyze and resolve incidents.Access to execution details
To view the details of a microservice’s execution:- Go to Operations.
- Select the corresponding operation.
- In the menu, open the Workspaces tab.
- In the Actions column of the table, click View microservice details.
Execution detail information
The microservice execution details view includes the following information:- Started on. Date and time the execution started.
- Finished on. Date and time the execution finished.
- Duration. Total time elapsed between start and finish.
- Microservice executed. Identifier code of the microservice.
- Output. Information generated as a result of the execution, useful for validating the result and analyzing potential incidents.