Diagnosis
From the Diagnosis option, you can perform a detailed analysis of a device's resource consumption, as well as the applications and processes used in the user's session.
Web Interface
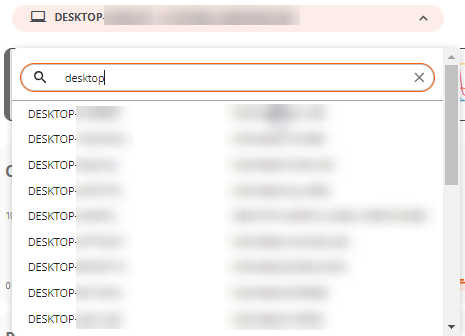
From the Diagnosis dropdown menu, you can search for a device and the user session you want to analyze. If you start typing a username, the dropdown menu will filter to show only devices that match that name.
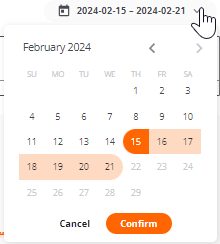
It's possible to select a one-week date range for the analysis; by default, data from the last seven days will be shown, although you can select a custom period by clicking the dropdown list. Only the devices used in the selected period will appear.
When you want to explore a different time span, the calendar will mark the days the device wasn't used with a lighter color.
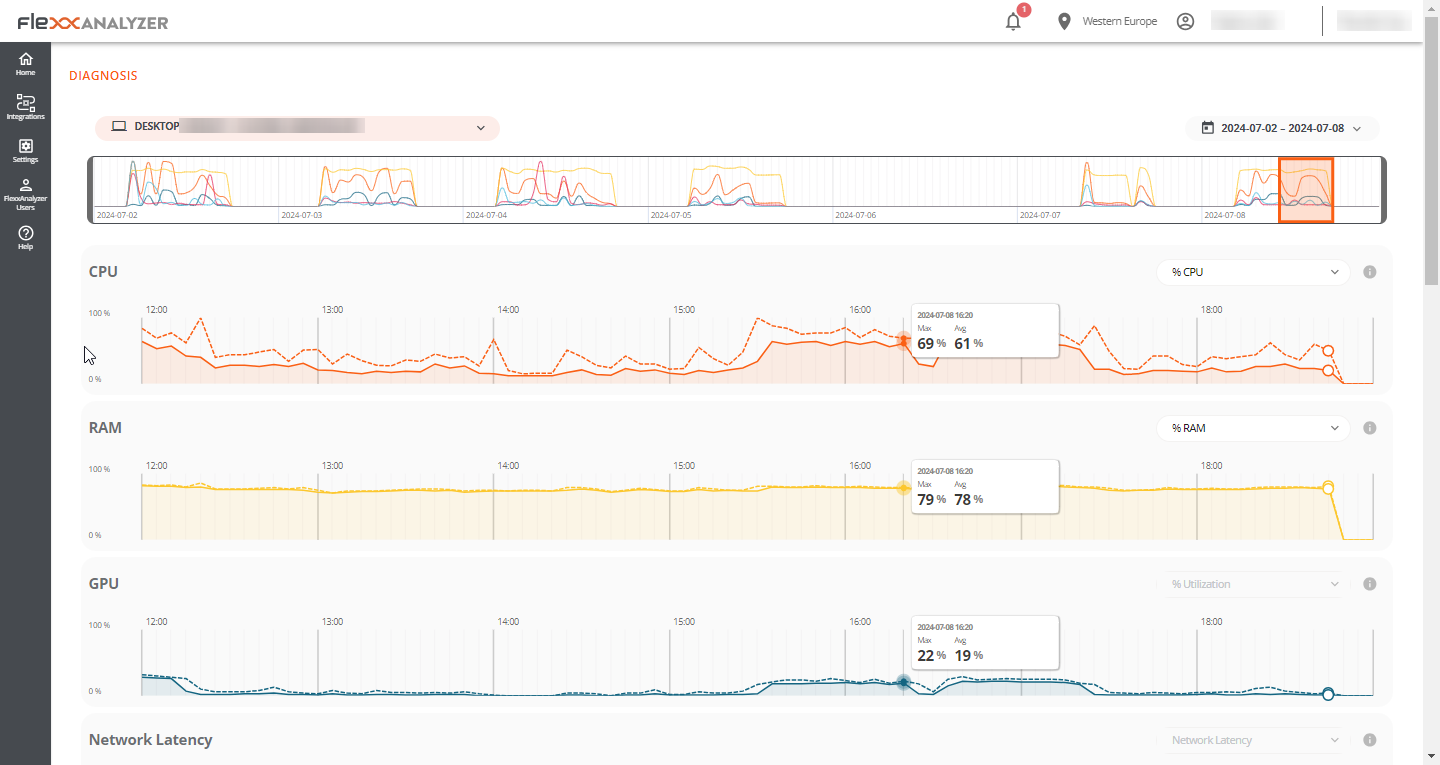
Once the selections are made, the resource consumption information for the selected period, device, and user will be displayed.
Timeframe selection
Once the device, user, and dates on which you want to see the data analysis are selected, a chart will appear at the top, with a six-hour zoom window.
You can drag and drop the selection area on the chart to view the resource consumption data for a more specific period.
You can also click on a point on the chart to see the resource consumption data for that specific moment without manually dragging the selection area. The rest of the page data will reflect the selected period, device, and user.
Resource consumption charts
After placing the time window at the exact point that needs to be analyzed, five resource consumption charts will be displayed at the bottom area: CPU, RAM, GPU, Network Latency, and Disk Usage. Each chart will show six hours corresponding to the selection area in the timeline chart.
The charts show the total resources consumed by the device. If more than one user was using the device during that period, the charts will show the resources consumed by all users.
Hovering over any of the charts will display a box with the resource consumption for that specific moment. You can click on any point of any of the charts to see which applications and processes were running at that specific moment; by default, the most recent data for the selected period will be displayed.
Performance Counters
Each counter on the screen includes several display options.
CPU
- % CPU: shows the total CPU usage in the system, equivalent to what Task Manager shows.
- % User Time: represents the percentage of CPU time utilized by applications and processes running in user mode.
- % Privileged time: indicates the percentage of CPU time used by the operating system and system services in privileged mode.
- % Processor time: shows the total CPU time used across all system processes and activities.
RAM
- % RAM: shows the total memory usage in the system, equivalent to what Task Manager shows.
- Available RAM: represents the amount of free memory in the system for running new applications without causing performance issues.
- Committed MB: indicates the amount of virtual memory actively used by the running processes and applications.
GPU
- % utilization: shows the total GPU usage in the system, equivalent to what Task Manager shows.
Network Latency
- Network Latency: shows the system latencies.
Disk Usage
- Total IOPS: shows the total IOPS (input/output operations per second) generated by the applications and processes on the disk.
- IOPS read per second: sum of all read IOPS, per second.
- IOPS write per second: sum of all write IOPS, per second.
Applications and Processes Tables
At the bottom, you will find the application and process tables, which show all the applications and processes that the user had running on that device at the time marked with the time frame selection.
For each application, the name, the executable, and the resources it consumed are shown.
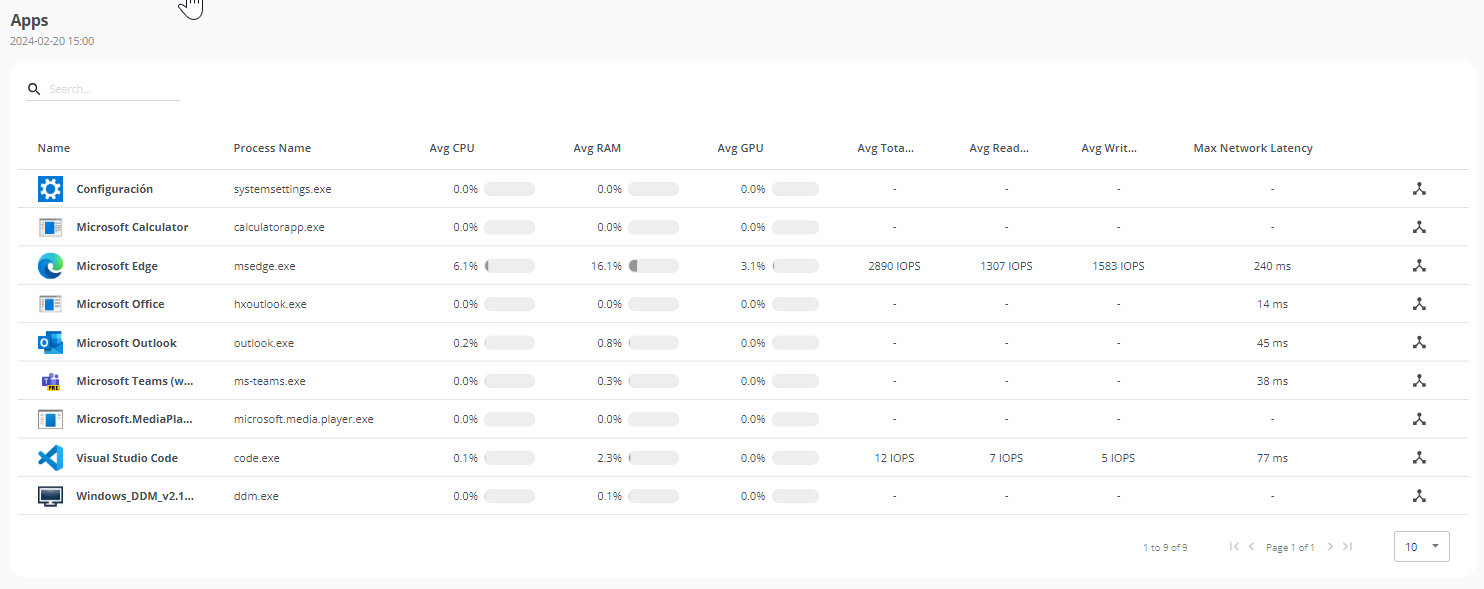
You can filter the table results using the search bar at the top of each one. You can also sort the results by clicking any of the columns in the table.
If you select a point on the chart to see the resource consumption data for a specific moment, the tables will automatically sort to show first the programs that consumed the most resources in the selected chart.