> ## Documentation Index
> Fetch the complete documentation index at: https://docs.flexxible.com/llms.txt
> Use this file to discover all available pages before exploring further.
# Workspace detail
Clicking a device's name opens its detail view.
From here you can:
* View expanded device information.
* Run remote assistance
 ### Device information
#### 1. Overview
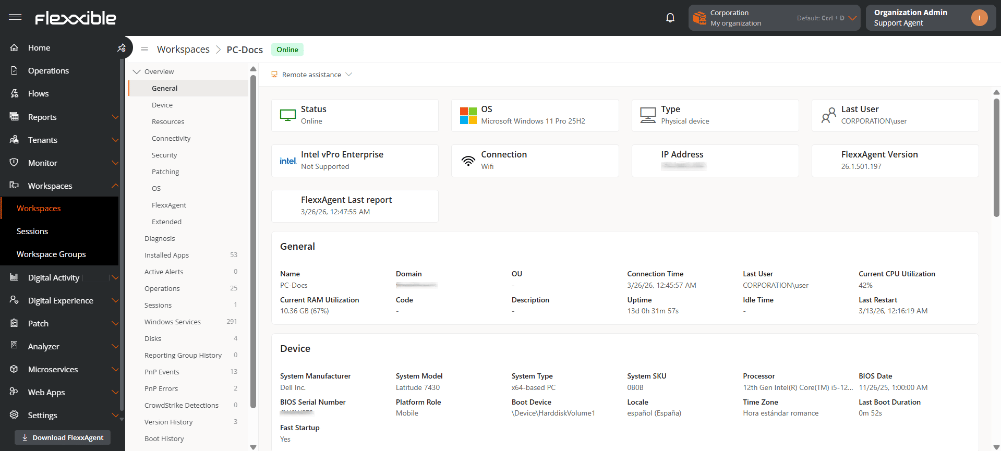
At the top of this view, a group of cards makes it easier to read device data: *Status*, *Operating System (OS)*, *Type*, *User*, *Intel vPro Enterprise*, *Connection*, *IP address*, *FlexxAgent version*, and *FlexxAgent last report*.
##### General
* **Name.** Identifier assigned to the device within the network or system. It generally corresponds to the hostname configured in the operating system.
* **Domain.** Name of the domain to which the device belongs within the network infrastructure.
* **OU.** Organizational unit where the device is located within the domain.
* **Connection time.** Total duration of the current session or the time elapsed since the device established its last connection with the server or network.
* **Last user.** Name of the user who last signed in to the device.
* **Current CPU usage.** Percentage of central processing unit (CPU) usage at the time of the query. Indicates the system's workload.
* **Current RAM usage.** Percentage of RAM currently in use by the system and active applications. Lets you evaluate resource consumption.
* **Code.** Unique identifier or internal code assigned to the device for inventory or administrative management purposes.
* **Description.** Descriptive information about the device, any additional relevant details.
* **Uptime.** Period of time the device has remained powered on and running continuously since the last restart.
* **Downtime.** Period during which the device has been powered off, disconnected, or out of service.
* **Last restart.** Date and time when the device was last restarted. Useful for monitoring system stability and maintenance.
##### Device
* **Operating system manufacturer.** Company or entity responsible for developing and distributing the operating system installed on the device.
* **System model.** Specific identification of the hardware model according to the manufacturer. Lets you recognize the version or product line of the equipment.
* **System type.** Classification of the device according to its architecture or purpose (for example: workstation, laptop, server, virtual machine, etc.).
* **System SKU.** Commercial reference code (Stock Keeping Unit) assigned by the manufacturer to identify the exact configuration of the model.
* **Processor.** Technical details of the installed CPU, including manufacturer, model, clock speed, and architecture.
* **BIOS date.** Date of the current BIOS or UEFI version installed on the system. Indicates when it was issued or updated by the manufacturer.
* **BIOS serial number.** Unique identifier associated with the specific BIOS version of the device.
* **Platform role.** Main function of the device within the environment (for example: desktop, virtual machine, etc.).
* **Boot device.** Drive or medium from which the operating system starts.
* **Regional settings.** Language setting configured on the system.
* **Time zone.** Time zone set on the system to synchronize date and time.
* **Last boot duration.** Total time the system took to complete the boot process from power-on until it was operational.
* **Fast startup.** Indicates whether the Fast Startup feature is enabled.
##### Resources
* **CPU cores.** Total number of physical cores available in the processor. Directly affects performance and parallel processing capacity.
* **Total RAM.** Total amount of physical memory (RAM) installed on the device.
* **Paging file space.** Total size of the disk space allocated to the paging file used to extend virtual memory.
* **Paging file.** Location and name of the file used by the operating system to manage virtual memory.
* **System disk usage.** Percentage or amount of space currently occupied on the main drive where the operating system is installed.
* **Total hard disk size.** Total physical storage capacity of the main disk or system drive.
##### Connectivity
* **Connection.** Type of active network connection (for example: wired, wireless, VPN, virtual network).
* **IP version.** Internet protocol used by the network interface.
* **IP address.** Address assigned to the device within the local network for identification and communication.
* **Subnet.** Network range that determines the segment the IP address belongs to.
* **Default gateway.** IP address of the router or device that enables communication with external networks.
* **MAC address.** Unique physical identifier assigned to the device's network card.
* **Network changed.** Indicates whether the device has recently changed networks.
* **Public IP.** Externally visible IP address assigned by the Internet Service Provider (ISP).
* **ISP.** Internet Service Provider. Company that provides Internet access to the device or local network.
* **City.** City or geographic locality associated with the detected public IP.
* **Country.** Country corresponding to the geographic location of the public IP.
* **Last network information update.** Date and time when the device's connectivity information was last updated.
##### Security
* **Encrypted hard drive.** Indicates whether the device's main storage is protected by encryption.
* **Secure Boot status.** Shows whether the BIOS/UEFI Secure Boot feature is enabled to prevent unauthorized software from loading during boot.
* **Kernel DMA Protection.** Indicates whether the system has direct memory access (DMA) protection enabled to prevent attacks on the kernel from external devices.
* **EDR.** Endpoint Detection and Response. Name or implemented advanced security solution for threat detection and response at the endpoint.
* **EDR status.** Operational status of the EDR system.
* **Antivirus.** Name of the antivirus solution installed or integrated in the system.
* **Antivirus status.** Operational status of the solution.
##### Update
* **Target.** Update policy the device belongs to.
* **Number of pending updates.** Total number of updates available but not yet installed on the system.
* **Last Windows update.** Date and time when the most recent Windows operating system update was installed.
* **Pending restart.** Indicates whether the system requires a restart to complete the installation of updates or other configuration changes.
* **Number of days since last Windows update.** Time interval (in days) since the last successful installation of operating system updates.
##### OS
* **OS.** Full name of the operating system installed on the device.
* **Operating system version.** Specific version number of the operating system that indicates its revision or current update level.
* **OS build.** Internal build number of the operating system that reflects the exact set of updates applied.
* **Windows directory.** Root directory path where the Windows operating system is installed.
* **System directory.** Subdirectory path containing the main operating system files.
##### FlexxAgent
* **Reporting group.** Name of the reporting group the device belongs to.
* **Version.** Version number of FlexxAgent installed on the device.
* **Status.** Indicates whether it is stopped or running.
* **Last report.** Date and time of the last time FlexxAgent sent its last report to the device.
* **Session Analyzer.** Indicates whether the Analyzer session is configured on the device.
* **Session Analyzer version.** Indicates the version number of the Analyzer session on the device.
* **Uninstall protection.** Indicates whether uninstall protection is enabled.
##### Extended
* **SMBIOS version.** Version of the System Management BIOS implemented in the system.
* **Embedded controller version.** Version of the embedded firmware or controller.
* **BIOS mode.** Indicates whether the system operates in Legacy BIOS or UEFI mode.
* **Motherboard manufacturer.** Company responsible for designing and producing the device's motherboard.
* **Motherboard model.** Identification or reference of the specific installed motherboard model.
* **Motherboard version.** Number or code specifying the revision or version of the motherboard design.
* **Unique ID.** Unique identifier assigned to the device or system.
* **Windows type.** License type or edition of the Windows operating system.
* **Creation date.** Date and time when the original operating system installation was performed.
##### Virtualization
* **Hypervisor.** Software or virtualization platform that manages the virtual machines.
* **Farm / Cluster.** Set of servers or nodes grouped to run and manage virtual machines together.
* **Broker.** Intermediary server responsible for managing user connections to virtual machines or remote desktops.
* **Delivery group.** Set of virtualized desktops or applications.
* **Status.** Current operational status of the virtual machine.
* **Citrix XD status.** Specific status of the device within the Citrix environment.
* **Registration status.** Indicates whether the device or virtual machine is properly registered in the management system or broker.
* **Maintenance mode.** Defines whether the machine is marked for maintenance tasks, preventing its assignment to end users.
* **Type.** Classification of the virtual resource.
* **Group / Catalog name.** Name assigned to the group or catalog of virtual machines within the virtualization environment.
* **Connected from.** IP address, host name, or location from which the user established the connection to the virtual environment.
#### 2. Diagnostics
This section lets you analyze a device's resource consumption based on the use of applications and system processes used during a user's session.
To view the data, you first need to select:
* **User.** If the device has more than one user session started, this lets you choose the one you want to analyze.
* **Date range.** Defines the analysis week. By default, data for the last seven days is shown.
##### Selection chart
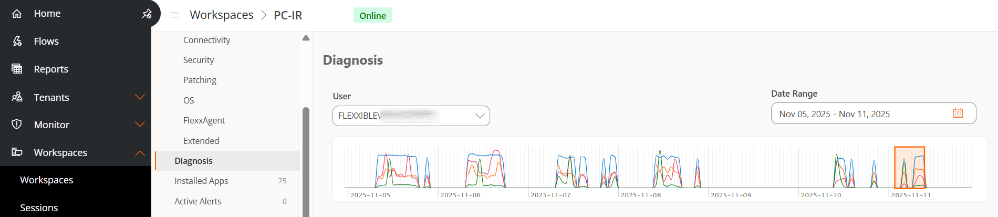
Once the user and date range are selected, the selection chart displays a general view of resource consumption. It represents, using colored lines, the behavior of each system resource (CPU, RAM, GPU, Network, and Disk) during the specified period.
The time window (orange box) lets you delimit a seven-hour time range. When you move it, the charts below, corresponding to each system resource, will update their data to show the detailed consumption during those hours.
### Device information
#### 1. Overview
At the top of this view, a group of cards makes it easier to read device data: *Status*, *Operating System (OS)*, *Type*, *User*, *Intel vPro Enterprise*, *Connection*, *IP address*, *FlexxAgent version*, and *FlexxAgent last report*.
##### General
* **Name.** Identifier assigned to the device within the network or system. It generally corresponds to the hostname configured in the operating system.
* **Domain.** Name of the domain to which the device belongs within the network infrastructure.
* **OU.** Organizational unit where the device is located within the domain.
* **Connection time.** Total duration of the current session or the time elapsed since the device established its last connection with the server or network.
* **Last user.** Name of the user who last signed in to the device.
* **Current CPU usage.** Percentage of central processing unit (CPU) usage at the time of the query. Indicates the system's workload.
* **Current RAM usage.** Percentage of RAM currently in use by the system and active applications. Lets you evaluate resource consumption.
* **Code.** Unique identifier or internal code assigned to the device for inventory or administrative management purposes.
* **Description.** Descriptive information about the device, any additional relevant details.
* **Uptime.** Period of time the device has remained powered on and running continuously since the last restart.
* **Downtime.** Period during which the device has been powered off, disconnected, or out of service.
* **Last restart.** Date and time when the device was last restarted. Useful for monitoring system stability and maintenance.
##### Device
* **Operating system manufacturer.** Company or entity responsible for developing and distributing the operating system installed on the device.
* **System model.** Specific identification of the hardware model according to the manufacturer. Lets you recognize the version or product line of the equipment.
* **System type.** Classification of the device according to its architecture or purpose (for example: workstation, laptop, server, virtual machine, etc.).
* **System SKU.** Commercial reference code (Stock Keeping Unit) assigned by the manufacturer to identify the exact configuration of the model.
* **Processor.** Technical details of the installed CPU, including manufacturer, model, clock speed, and architecture.
* **BIOS date.** Date of the current BIOS or UEFI version installed on the system. Indicates when it was issued or updated by the manufacturer.
* **BIOS serial number.** Unique identifier associated with the specific BIOS version of the device.
* **Platform role.** Main function of the device within the environment (for example: desktop, virtual machine, etc.).
* **Boot device.** Drive or medium from which the operating system starts.
* **Regional settings.** Language setting configured on the system.
* **Time zone.** Time zone set on the system to synchronize date and time.
* **Last boot duration.** Total time the system took to complete the boot process from power-on until it was operational.
* **Fast startup.** Indicates whether the Fast Startup feature is enabled.
##### Resources
* **CPU cores.** Total number of physical cores available in the processor. Directly affects performance and parallel processing capacity.
* **Total RAM.** Total amount of physical memory (RAM) installed on the device.
* **Paging file space.** Total size of the disk space allocated to the paging file used to extend virtual memory.
* **Paging file.** Location and name of the file used by the operating system to manage virtual memory.
* **System disk usage.** Percentage or amount of space currently occupied on the main drive where the operating system is installed.
* **Total hard disk size.** Total physical storage capacity of the main disk or system drive.
##### Connectivity
* **Connection.** Type of active network connection (for example: wired, wireless, VPN, virtual network).
* **IP version.** Internet protocol used by the network interface.
* **IP address.** Address assigned to the device within the local network for identification and communication.
* **Subnet.** Network range that determines the segment the IP address belongs to.
* **Default gateway.** IP address of the router or device that enables communication with external networks.
* **MAC address.** Unique physical identifier assigned to the device's network card.
* **Network changed.** Indicates whether the device has recently changed networks.
* **Public IP.** Externally visible IP address assigned by the Internet Service Provider (ISP).
* **ISP.** Internet Service Provider. Company that provides Internet access to the device or local network.
* **City.** City or geographic locality associated with the detected public IP.
* **Country.** Country corresponding to the geographic location of the public IP.
* **Last network information update.** Date and time when the device's connectivity information was last updated.
##### Security
* **Encrypted hard drive.** Indicates whether the device's main storage is protected by encryption.
* **Secure Boot status.** Shows whether the BIOS/UEFI Secure Boot feature is enabled to prevent unauthorized software from loading during boot.
* **Kernel DMA Protection.** Indicates whether the system has direct memory access (DMA) protection enabled to prevent attacks on the kernel from external devices.
* **EDR.** Endpoint Detection and Response. Name or implemented advanced security solution for threat detection and response at the endpoint.
* **EDR status.** Operational status of the EDR system.
* **Antivirus.** Name of the antivirus solution installed or integrated in the system.
* **Antivirus status.** Operational status of the solution.
##### Update
* **Target.** Update policy the device belongs to.
* **Number of pending updates.** Total number of updates available but not yet installed on the system.
* **Last Windows update.** Date and time when the most recent Windows operating system update was installed.
* **Pending restart.** Indicates whether the system requires a restart to complete the installation of updates or other configuration changes.
* **Number of days since last Windows update.** Time interval (in days) since the last successful installation of operating system updates.
##### OS
* **OS.** Full name of the operating system installed on the device.
* **Operating system version.** Specific version number of the operating system that indicates its revision or current update level.
* **OS build.** Internal build number of the operating system that reflects the exact set of updates applied.
* **Windows directory.** Root directory path where the Windows operating system is installed.
* **System directory.** Subdirectory path containing the main operating system files.
##### FlexxAgent
* **Reporting group.** Name of the reporting group the device belongs to.
* **Version.** Version number of FlexxAgent installed on the device.
* **Status.** Indicates whether it is stopped or running.
* **Last report.** Date and time of the last time FlexxAgent sent its last report to the device.
* **Session Analyzer.** Indicates whether the Analyzer session is configured on the device.
* **Session Analyzer version.** Indicates the version number of the Analyzer session on the device.
* **Uninstall protection.** Indicates whether uninstall protection is enabled.
##### Extended
* **SMBIOS version.** Version of the System Management BIOS implemented in the system.
* **Embedded controller version.** Version of the embedded firmware or controller.
* **BIOS mode.** Indicates whether the system operates in Legacy BIOS or UEFI mode.
* **Motherboard manufacturer.** Company responsible for designing and producing the device's motherboard.
* **Motherboard model.** Identification or reference of the specific installed motherboard model.
* **Motherboard version.** Number or code specifying the revision or version of the motherboard design.
* **Unique ID.** Unique identifier assigned to the device or system.
* **Windows type.** License type or edition of the Windows operating system.
* **Creation date.** Date and time when the original operating system installation was performed.
##### Virtualization
* **Hypervisor.** Software or virtualization platform that manages the virtual machines.
* **Farm / Cluster.** Set of servers or nodes grouped to run and manage virtual machines together.
* **Broker.** Intermediary server responsible for managing user connections to virtual machines or remote desktops.
* **Delivery group.** Set of virtualized desktops or applications.
* **Status.** Current operational status of the virtual machine.
* **Citrix XD status.** Specific status of the device within the Citrix environment.
* **Registration status.** Indicates whether the device or virtual machine is properly registered in the management system or broker.
* **Maintenance mode.** Defines whether the machine is marked for maintenance tasks, preventing its assignment to end users.
* **Type.** Classification of the virtual resource.
* **Group / Catalog name.** Name assigned to the group or catalog of virtual machines within the virtualization environment.
* **Connected from.** IP address, host name, or location from which the user established the connection to the virtual environment.
#### 2. Diagnostics
This section lets you analyze a device's resource consumption based on the use of applications and system processes used during a user's session.
To view the data, you first need to select:
* **User.** If the device has more than one user session started, this lets you choose the one you want to analyze.
* **Date range.** Defines the analysis week. By default, data for the last seven days is shown.
##### Selection chart
Once the user and date range are selected, the selection chart displays a general view of resource consumption. It represents, using colored lines, the behavior of each system resource (CPU, RAM, GPU, Network, and Disk) during the specified period.
The time window (orange box) lets you delimit a seven-hour time range. When you move it, the charts below, corresponding to each system resource, will update their data to show the detailed consumption during those hours.
 ##### Resource consumption charts
Diagnosis lets you analyze, through five charts, the behavior of each system resource: CPU, RAM, GPU, Network, and Disk. Each of them has a drop-down with specific parameters to filter the results.
Hovering over a point on the chart displays specific information: date, time, and maximum and minimum values of the corresponding parameter.
##### Parameters by system resource type
##### CPU
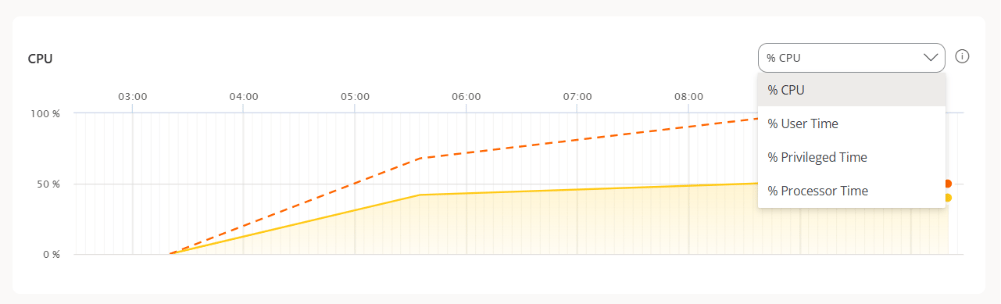
* **% CPU.** Total percentage of CPU usage across all cores.
* **% User time.** Percentage of CPU time spent running processes in user mode.
* **% Privileged time.** Percentage of CPU time spent running system (kernel) operations.
* **% Processor.** Total CPU time used across all processes and system activities.
##### Resource consumption charts
Diagnosis lets you analyze, through five charts, the behavior of each system resource: CPU, RAM, GPU, Network, and Disk. Each of them has a drop-down with specific parameters to filter the results.
Hovering over a point on the chart displays specific information: date, time, and maximum and minimum values of the corresponding parameter.
##### Parameters by system resource type
##### CPU
* **% CPU.** Total percentage of CPU usage across all cores.
* **% User time.** Percentage of CPU time spent running processes in user mode.
* **% Privileged time.** Percentage of CPU time spent running system (kernel) operations.
* **% Processor.** Total CPU time used across all processes and system activities.
 ##### RAM
* **% RAM.** Percentage of physical memory currently in use.
* **MB available.** Amount of free RAM available to run new applications without causing performance issues.
* **MB committed.** Amount of virtual memory that has been committed.
##### GPU
* **% GPU.** Percentage of the graphics processing unit (GPU) capacity currently being used.
* **GPU utilization.** Percentage of time the GPU is actively processing.
##### Network
* **Network latency.** Maximum latency of all listed applications and processes.
##### Disk
* **Total IOPS.** Total input/output operations per second for disk activity.
* **Read IOPS per second.** Number of read operations per second from the disk.
* **Write IOPS per second.** Sum of write operations of applications and processes.
* **% Disk usage.** Percentage of the disk's input and output capacity currently being used.
##### Applications and processes tables
At the bottom are the *Applications* and *Processes* tables, which show the data corresponding to the most recent moment of the time range chosen in the selection chart.
##### Applications
Shows the applications active on the device.
Each row includes the following fields:
* **Name.** Name of the application.
* **Process name.** Process associated with the application.
* **Average CPU.** Average percentage of CPU usage.
* **Average RAM.** Average percentage of physical memory in use.
* **Average GPU.** Average percentage of GPU usage.
* **Average total IOPS.** Average input/output operations per second.
* **Average read IOPS.** Average read operations per second.
* **Average write IOPS.** Average write operations per second.
* **Maximum network latency.** Maximum latency recorded for the application.
##### Summary card
Selecting an application from the table opens a more visual summary card with its system resource usage metrics.
##### Processes
Shows the processes active on the device.
Each row includes the following fields:
* **Name.** Name of the product or process.
* **Process name.** Name of the executable.
* **User.** User running the process.
* **Average CPU.** Average percentage of CPU usage.
* **Average RAM.** Average percentage of physical memory in use.
* **Average GPU.** Average percentage of GPU usage.
* **Average total IOPS.** Average input/output operations per second.
* **Average read IOPS.** Average read operations per second.
* **Average write IOPS.** Average write operations per second.
* **Maximum network latency.** Maximum latency recorded for the process.
#### 3. Real-time connections
This section provides real-time visibility over external network connections established by the device's processes and applications. It offers two complementary views: a process table with the technical details of each connection, and an interactive map that geographically represents the destinations of those connections.
#### Requirements
This section will not display data if any of the following conditions are met:
* The device is powered off or is not reporting to the system.
* The version of FlexxAgent installed on the device is earlier than 26.6.
#### 3.1 Connections
This view lists all processes and applications on the device that have active external network connections. For each process, data is collected on status, protocol, ports, owning user, and latency metrics.
The section is divided into two subsections: **Network interfaces** and **Process table**.
##### Network interfaces
Shows the network interfaces active on the system at the time of the query. For each interface, the following information is exposed:
| Field | Description | |
| ------ | ----------------------------------------- | - |
| Name | Identifier of the interface on the system | |
| Type | Interface type (Ethernet, Wi-Fi, etc.) | |
| Speed | Negotiated link speed | |
| Driver | Device driver name | |
##### Process table
| Column | Description |
| ------------------- | ------------------------------------------------------------------------------------------------ |
| **Process** | Name of the process or application. |
| **Protocol** | Transport protocol used: **TCP** or **UDP**. |
| **Local address** | Local IP address of the connection. |
| **Local port** | Local port associated with the connection. |
| **Remote address** | IP address of the remote host. |
| **Remote port** | Port on the remote host the process connects to. |
| **User** | Operating system user that owns the process. |
| **Latency** | Last latency value recorded for the connection. |
| **Status** | Current connection status: **Established**, **Bound**, or **Listening**. |
| **Duration** | Time elapsed since the connection was established. |
| **Alert** | Indicator active when a change in the connection status is detected during the refresh interval. |
| **PID** | Process identifier in the operating system. |
| **Location** | Destination city of the connection, based on the geolocation of the remote IP. |
| **Average latency** | Latency average calculated over the sample history. |
| **Minimum latency** | Minimum latency value recorded. |
| **Maximum latency** | Maximum latency value recorded. |
##### Available actions
The top bar of the table includes the following controls:
* **Search.** Filters processes by name in real time.
* **Filter by status.** Lets you narrow the view to connections in a specific status (for example, **Established**, **Listening**).
* **Auto-refresh.** Configures the automatic refresh interval for the data.
* **Export.** Downloads the table content in the available format.
#### 3.2 Map
The map view geographically represents, on an interactive map, the destinations of the active connections of all processes and applications on the device. Information is updated in real time.
##### Map controls
**Search / Process filter.** Lets you show only the connections associated with one or more specific processes.
##### Information for each destination
Clicking a line on the map opens a panel with detailed statistics for that destination:
| Field | Description |
| --------------------- | ----------------------------------------------------------------------- |
| **Location** | City corresponding to the destination. |
| **Coordinates** | Latitude and longitude of the geolocated point. |
| **Total connections** | Total number of active connections to that destination. |
| **Remote IPs** | List of all remote IP addresses used at that destination. |
| **Average latency** | Latency average to that destination, calculated across all connections. |
In addition, the panel breaks down the information by process, showing for each one:
* Process name
* Number of active connections to that destination
* Remote IPs used
* Average latency of the process to that destination
##### Lines by latency
Each line uses the average latency (ms) of its connections:
| Status | Latency | Color |
| ------- | ------------------- | ------ |
| Good | \< 150 ms | Green |
| Medium | 150–250 ms | Yellow |
| Bad | > 250 ms or timeout | Red |
| No data | - or empty | Gray |
#### 4. Installed applications
Shows a table with all the applications detected by FlexxAgent Analyzer on the device.
The information includes:
* **Name.** Name of the application installed on the device.
* **Publisher.** Company that developed the application.
* **Version.** Version of the application.
* **Installed on.** Date on which it was first reported on the device.
* **Install location.** Folder where the application is located.
* **Last report.** Date of its last report on the device.
The information provided by **Installed applications** is collected by FlexxAgent Analyzer when its process starts. From then on, the data is updated every 12 hours, provided that a user session is started, or at each sign-in.
#### 5. Active alerts
Presents a table with the active alerts found on the device.
The information includes:
* **Severity.** Severity level (*Critical*, *Warning*, or *Informational*).
* **Alert name.** Name that identifies the alert. You can click it to get more details.
* **Information.** Description of the alert.
* **Start date.** Day and time when the alert is recorded.
* **Notification date.** Day and time of the alert notification.
* **Item.** Name of the device where the alert is recorded.
#### 6. Intel vPro
From this tab you can consult detailed information about the Intel EMA agent installed on the device and access out-of-band management functions, even when the operating system is not available.
##### Information details
* **Intel AMT compatible.** Indicates whether the device is compatible with Intel Active Management Technology.
* **EMA agent version.** Version number installed on the device.
* **Intel EMA ID.** Unique identifier assigned by Intel EMA.
* **Intel EMA agent status.** Indicates whether the agent is *Connected* or *Disconnected*.
* **CIRA status.** Indicates whether Client Initiated Remote Access, used for secure remote access, is *Connected* or *Disconnected*.
* **Status.** Shows whether the device is *Powered on* or *Powered off*.
* **Power state update.** Date and time of the last change to the power state.
##### Available actions
Intel vPro lets you perform remote administration operations even when the operating system has not started or the device does not respond. These actions are executed out of band, accessing the hardware directly.
* **Power on.** Powers on the device.
* **Restart.** Restarts the device.
* **Power actions**: *Shut down gracefully*, *Restart gracefully*, *Shut down*, *Sleep*, *Hibernate*.
* **Boot actions**
* **Boot to BIOS.** Lets you go directly to the BIOS on devices that cannot boot their operating system.
* **Remote KVM connection.** Shows a direct view of the device's screen to control it as if you were physically in front of it, even when the operating system does not load.
This feature lets you:
* View the device's screen in real time.
* Diagnose and resolve issues in geographically distributed environments or those with limited IT resources, since it avoids on-site interventions.
##### Automatic power-on scheduling
This technology also lets you configure the date, time, and recurrence of the device's automatic power-on.
###### Create a schedule
1. Go to **Worksaces** → **Workspaces**.
2. Select a device from the list.
3. In the side menu, select the **Intel vPro** tab.
4. In the **Automatic power-on scheduling** section, click **New**.
5. Fill in the data requested in the form:
* **Schedule name.** Name of the power-on schedule.
* **Start time (UTC).** Date and time when the device will be powered on, in UTC.
* **Delete on completion?** If selected, once the power-on has been executed, the schedule will be deleted.
* **Is it recurring?** If enabled, lets you indicate every how many days and at what time the device will be powered on.
6. Click **New**.
#### 7. Operations
This tab lets you consult all operations executed on the device, providing full visibility over administrative actions, remote assistance sessions, and automated tasks performed from the platform.
The information is presented in table format and makes it easier to track the status, source, and result of each operation.
The operations table includes the following fields:
* **Description.** Brief explanation of the operation performed. Clicking it opens the action detail.
* **Operation type.** Identifies the action executed.
* **Status.** Current situation of the execution: *In progress*, *Error*, *Finished*, or *Pending*.
* **Started by.** User who executed the operation.
* **Started on.** Start date and time of the execution.
* **Finished on.** End date and time of the execution.
* **Created on.** Date and time when the operation record was created.
* **FRA start.** Start date and time of Flexxible Remote Assistance (FRA), if applicable.
* **FRA end.** End date and time of Flexxible Remote Assistance (FRA), if applicable.
* **FRA type.** Type of Flexxible Remote Assistance (FRA) executed: *Attended*, *Unattended*, or *Dynamic*.
##### Operation detail
Selecting an operation from the table opens a detailed view that lets you analyze its execution and result.
##### Summary
This section shows consolidated information about the operation:
* **Operation type**
* **Description**
* **Started on**
* **Finished on**
* **Started by**
* **Status (Global).** Overall status of the operation.
* **Status (Workspace).** Specific status of the operation on the device.
* **Workspaces.** Devices associated with the operation.
* **Summary.** Visual indicator of the overall result of the operation:
* Green: *Finished*
* Yellow: *Pending*
* Red: *Error*
* Gray: *Unknown*
##### Events
This section shows the history of events generated by the system during the execution of the operation, which lets you diagnose errors or verify progress.
Each event includes:
* **Date.** Date and time when the event was recorded.
* **Type.** Event level: *Information*, *Error*, or *Critical*.
* **Source.** System component that generated the event.
* **Message.** Detailed description of the event.
The **View full events** button redirects to the Operations section, where you can consult expanded information and the full execution history.
#### 8. Sessions
Shows active or recorded sessions, with details such as:
* **User.** Name of the user signed in to the device.
* **Session type.** Type of session started (*Device* or *Application*, for virtualized application sessions).
* **Windows session ID.** Unique identifier assigned to each user session.
* **Connection status.** Status of the session connection (*Disconnected* or *Active*).
* **Start date.** Date and time when the session started.
* **CPU usage.** Percentage of processor usage of the session, excluding the resources used by other sessions or system processes.
* **RAM usage.** Amount of temporary memory used by the activities and applications of a specific user during a session.
* **RTT usage.** Time it takes for a data packet to travel from the user's device to a server or remote destination and then back to the user.
#### 9. Windows services
Contains the list of operating system services, including:
* **Display name.** Name of the programs that run in the background.
* **Status.** Status of the Windows services (*Running* or *Stopped*).
* **Start type.** How the service has been activated (*Automatic*, *Manual*, or *Disabled*).
* **Log on as.** Sign-in mode.
* **Accept stop.** Whether Windows services can be stopped or not (*Yes* or *No*)
#### 10. Disks
Shows the partitions of the device with the following information:
* **Device ID.** Name of the device.
* **Name.** Name of the disk's main partition.
* **Encrypted.** Indicates whether the device is encrypted, or whether no value is available (N/A).
* **Encryption method.** Indicates the encryption method.
* **Volume label.** Name of the volume label.
* **Total size.** In megabytes, total disk space.
* **Used size.** In megabytes, used disk space.
* **Used percentage.** As a percentage, used disk space.
* **OS drive.** Drive ownership (*Yes* or *No*).
* **Location.** Path to the disk's location.
* **Partition.** Indicates the number of storage divisions the disk has.
#### 11. Reporting group history
Shows the current and previous reporting groups for the device:
* **Source.** Reporting group the device came from.
* **Target.** Reporting group the device is entering.
* **Assignment type.** *Manual* or *Automatic* assignment.
* **Requested date.** Date and time of the device's reporting group change.
#### 12. PnP events
Shows a table with the list of Plug and Play events recorded on the device. The information includes:
* **Action.** Status of the hardware component (printer, mouse, etc.) with respect to the device (*Plugged in* or *Unplugged*).
* **Date.** Last PnP update recorded by FlexxAgent.
* **User.** User currently using the device.
* **Description.** Hardware component connected to the device.
* **Device ID.** Identification code of the hardware component connected to the device.
#### 13. PnP errors
Shows a table with the list of Plug and Play errors recorded on the device. The information includes:
* **Name.** Name of the hardware component connected to the device.
* **Update date.** Last PnP update recorded by FlexxAgent.
* **Class.** Type of hardware component connected to the device.
* **Device ID.** Identification code of the hardware component connected to the device.
#### 14. CrowdStrike detections
If the CrowdStrike integration has been set up from the platform, a table will be shown with information about threat detections, including the following fields:
* **Severity.** Criticality level assigned to the detection based on the potential impact or risk of the threat.
* **Created.** Date and time when the detection was generated in the system.
* **User name.** User associated with the activity or process that triggered the detection.
* **Status.** Current status of the detection.
* **Display name.** Descriptive name assigned to the detection, which summarizes the type of threat or behavior identified.
* **Description.** Expanded information about the detection.
* **Command line.** Command or instruction executed on the device that generated or is related to the detection.
FlexxAgent syncs CrowdStrike alerts every minute.
#### 15. Version history
Presents a table with the FlexxAgent versions that have been recorded on the device.
* **Version.** FlexxAgent version number detected on the device.
* **Discovered on.** Date and time when the system identified the presence of that FlexxAgent version on the device.
#### 16. Boot history
Through a chart, this section shows the record of the boot time the device has had.
#### 17. Installed updates
Presents a table with the list of updates installed on the device. The information includes:
* **Install date.** Date and time when the update was installed on the device.
* **KB.** Unique identifier of the update package issued by Microsoft.
* **Title.** Name of the update.
* **Product.** Name of the product to which the update applies.
* **Severity.** Criticality level assigned to the update according to its importance or impact on security (*Critical*, *Important*, *Moderate*, *Low*, *Unspecified*).
* **Arrival date.** Date when the update was published or made available by the vendor.
* **Category.** Functional or technical classification of the update.
#### 18. Pending updates
Shows a table with the list of updates pending on the device. The information includes:
* **KB.** Unique identifier of the update package issued by Microsoft.
* **Title.** Name of the update.
* **Product.** Name of the product to which the update applies.
* **Severity.** Criticality level assigned to the update according to its importance or impact on security (*Critical*, *Important*, *Moderate*, *Low*, *Unspecified*).
* **Arrival date.** Date when the update was published or made available by the vendor.
* **Category.** Functional or technical classification of the update.
#### 19. FlexxAgent logs
This section shows the log files generated by the agent and collected from the device.
##### Information available in the logs table
The logs table includes the following information:
* **File name.** Name of the file generated by FlexxAgent.
* **Session.** Identifier of the installation or execution session the log belongs to.
* **Size.** Size of the log file.
* **Uploaded on.** Date and time when the log was uploaded to the platform.
* **Actions.** Operations available for the log file.
* **View.** Displays the contents of the agent log.
* **Download.** Lets you download the log file for local analysis.
##### Collect agent logs
The **Collect agent logs** button, located at the top of the table, lets you request log collection from the device for the time interval for which you want to obtain the logs.
Collection generates an operation that can be monitored from the Operations section.
##### Log retention
**FlexxAgent** stores logs locally on the device for a maximum period of five days. After that time, older files are automatically deleted.
##### Log location on the device
In addition to being viewable from the platform, logs can be consulted directly on the system where the agent is installed.
For more information, see the [FlexxAgent](../../flexxagent/systems/windows) documentation.
FlexxAgent logs is only available on devices that have FlexxAgent cross-platform version 26.1.501.195 installed.
#### 19. Workspace groups
This section shows a table with the list of workspace groups the device belongs to.
The table includes the following fields:
* **Name.** Name of the workspace group.
* **Description.** Brief text explaining the purpose of the group.
* **Type.** Can be *Static*, *Dynamic*, or *Entra ID*.
* **Workspaces.** Total number of devices that are currently part of the group.
##### RAM
* **% RAM.** Percentage of physical memory currently in use.
* **MB available.** Amount of free RAM available to run new applications without causing performance issues.
* **MB committed.** Amount of virtual memory that has been committed.
##### GPU
* **% GPU.** Percentage of the graphics processing unit (GPU) capacity currently being used.
* **GPU utilization.** Percentage of time the GPU is actively processing.
##### Network
* **Network latency.** Maximum latency of all listed applications and processes.
##### Disk
* **Total IOPS.** Total input/output operations per second for disk activity.
* **Read IOPS per second.** Number of read operations per second from the disk.
* **Write IOPS per second.** Sum of write operations of applications and processes.
* **% Disk usage.** Percentage of the disk's input and output capacity currently being used.
##### Applications and processes tables
At the bottom are the *Applications* and *Processes* tables, which show the data corresponding to the most recent moment of the time range chosen in the selection chart.
##### Applications
Shows the applications active on the device.
Each row includes the following fields:
* **Name.** Name of the application.
* **Process name.** Process associated with the application.
* **Average CPU.** Average percentage of CPU usage.
* **Average RAM.** Average percentage of physical memory in use.
* **Average GPU.** Average percentage of GPU usage.
* **Average total IOPS.** Average input/output operations per second.
* **Average read IOPS.** Average read operations per second.
* **Average write IOPS.** Average write operations per second.
* **Maximum network latency.** Maximum latency recorded for the application.
##### Summary card
Selecting an application from the table opens a more visual summary card with its system resource usage metrics.
##### Processes
Shows the processes active on the device.
Each row includes the following fields:
* **Name.** Name of the product or process.
* **Process name.** Name of the executable.
* **User.** User running the process.
* **Average CPU.** Average percentage of CPU usage.
* **Average RAM.** Average percentage of physical memory in use.
* **Average GPU.** Average percentage of GPU usage.
* **Average total IOPS.** Average input/output operations per second.
* **Average read IOPS.** Average read operations per second.
* **Average write IOPS.** Average write operations per second.
* **Maximum network latency.** Maximum latency recorded for the process.
#### 3. Real-time connections
This section provides real-time visibility over external network connections established by the device's processes and applications. It offers two complementary views: a process table with the technical details of each connection, and an interactive map that geographically represents the destinations of those connections.
#### Requirements
This section will not display data if any of the following conditions are met:
* The device is powered off or is not reporting to the system.
* The version of FlexxAgent installed on the device is earlier than 26.6.
#### 3.1 Connections
This view lists all processes and applications on the device that have active external network connections. For each process, data is collected on status, protocol, ports, owning user, and latency metrics.
The section is divided into two subsections: **Network interfaces** and **Process table**.
##### Network interfaces
Shows the network interfaces active on the system at the time of the query. For each interface, the following information is exposed:
| Field | Description | |
| ------ | ----------------------------------------- | - |
| Name | Identifier of the interface on the system | |
| Type | Interface type (Ethernet, Wi-Fi, etc.) | |
| Speed | Negotiated link speed | |
| Driver | Device driver name | |
##### Process table
| Column | Description |
| ------------------- | ------------------------------------------------------------------------------------------------ |
| **Process** | Name of the process or application. |
| **Protocol** | Transport protocol used: **TCP** or **UDP**. |
| **Local address** | Local IP address of the connection. |
| **Local port** | Local port associated with the connection. |
| **Remote address** | IP address of the remote host. |
| **Remote port** | Port on the remote host the process connects to. |
| **User** | Operating system user that owns the process. |
| **Latency** | Last latency value recorded for the connection. |
| **Status** | Current connection status: **Established**, **Bound**, or **Listening**. |
| **Duration** | Time elapsed since the connection was established. |
| **Alert** | Indicator active when a change in the connection status is detected during the refresh interval. |
| **PID** | Process identifier in the operating system. |
| **Location** | Destination city of the connection, based on the geolocation of the remote IP. |
| **Average latency** | Latency average calculated over the sample history. |
| **Minimum latency** | Minimum latency value recorded. |
| **Maximum latency** | Maximum latency value recorded. |
##### Available actions
The top bar of the table includes the following controls:
* **Search.** Filters processes by name in real time.
* **Filter by status.** Lets you narrow the view to connections in a specific status (for example, **Established**, **Listening**).
* **Auto-refresh.** Configures the automatic refresh interval for the data.
* **Export.** Downloads the table content in the available format.
#### 3.2 Map
The map view geographically represents, on an interactive map, the destinations of the active connections of all processes and applications on the device. Information is updated in real time.
##### Map controls
**Search / Process filter.** Lets you show only the connections associated with one or more specific processes.
##### Information for each destination
Clicking a line on the map opens a panel with detailed statistics for that destination:
| Field | Description |
| --------------------- | ----------------------------------------------------------------------- |
| **Location** | City corresponding to the destination. |
| **Coordinates** | Latitude and longitude of the geolocated point. |
| **Total connections** | Total number of active connections to that destination. |
| **Remote IPs** | List of all remote IP addresses used at that destination. |
| **Average latency** | Latency average to that destination, calculated across all connections. |
In addition, the panel breaks down the information by process, showing for each one:
* Process name
* Number of active connections to that destination
* Remote IPs used
* Average latency of the process to that destination
##### Lines by latency
Each line uses the average latency (ms) of its connections:
| Status | Latency | Color |
| ------- | ------------------- | ------ |
| Good | \< 150 ms | Green |
| Medium | 150–250 ms | Yellow |
| Bad | > 250 ms or timeout | Red |
| No data | - or empty | Gray |
#### 4. Installed applications
Shows a table with all the applications detected by FlexxAgent Analyzer on the device.
The information includes:
* **Name.** Name of the application installed on the device.
* **Publisher.** Company that developed the application.
* **Version.** Version of the application.
* **Installed on.** Date on which it was first reported on the device.
* **Install location.** Folder where the application is located.
* **Last report.** Date of its last report on the device.
The information provided by **Installed applications** is collected by FlexxAgent Analyzer when its process starts. From then on, the data is updated every 12 hours, provided that a user session is started, or at each sign-in.
#### 5. Active alerts
Presents a table with the active alerts found on the device.
The information includes:
* **Severity.** Severity level (*Critical*, *Warning*, or *Informational*).
* **Alert name.** Name that identifies the alert. You can click it to get more details.
* **Information.** Description of the alert.
* **Start date.** Day and time when the alert is recorded.
* **Notification date.** Day and time of the alert notification.
* **Item.** Name of the device where the alert is recorded.
#### 6. Intel vPro
From this tab you can consult detailed information about the Intel EMA agent installed on the device and access out-of-band management functions, even when the operating system is not available.
##### Information details
* **Intel AMT compatible.** Indicates whether the device is compatible with Intel Active Management Technology.
* **EMA agent version.** Version number installed on the device.
* **Intel EMA ID.** Unique identifier assigned by Intel EMA.
* **Intel EMA agent status.** Indicates whether the agent is *Connected* or *Disconnected*.
* **CIRA status.** Indicates whether Client Initiated Remote Access, used for secure remote access, is *Connected* or *Disconnected*.
* **Status.** Shows whether the device is *Powered on* or *Powered off*.
* **Power state update.** Date and time of the last change to the power state.
##### Available actions
Intel vPro lets you perform remote administration operations even when the operating system has not started or the device does not respond. These actions are executed out of band, accessing the hardware directly.
* **Power on.** Powers on the device.
* **Restart.** Restarts the device.
* **Power actions**: *Shut down gracefully*, *Restart gracefully*, *Shut down*, *Sleep*, *Hibernate*.
* **Boot actions**
* **Boot to BIOS.** Lets you go directly to the BIOS on devices that cannot boot their operating system.
* **Remote KVM connection.** Shows a direct view of the device's screen to control it as if you were physically in front of it, even when the operating system does not load.
This feature lets you:
* View the device's screen in real time.
* Diagnose and resolve issues in geographically distributed environments or those with limited IT resources, since it avoids on-site interventions.
##### Automatic power-on scheduling
This technology also lets you configure the date, time, and recurrence of the device's automatic power-on.
###### Create a schedule
1. Go to **Worksaces** → **Workspaces**.
2. Select a device from the list.
3. In the side menu, select the **Intel vPro** tab.
4. In the **Automatic power-on scheduling** section, click **New**.
5. Fill in the data requested in the form:
* **Schedule name.** Name of the power-on schedule.
* **Start time (UTC).** Date and time when the device will be powered on, in UTC.
* **Delete on completion?** If selected, once the power-on has been executed, the schedule will be deleted.
* **Is it recurring?** If enabled, lets you indicate every how many days and at what time the device will be powered on.
6. Click **New**.
#### 7. Operations
This tab lets you consult all operations executed on the device, providing full visibility over administrative actions, remote assistance sessions, and automated tasks performed from the platform.
The information is presented in table format and makes it easier to track the status, source, and result of each operation.
The operations table includes the following fields:
* **Description.** Brief explanation of the operation performed. Clicking it opens the action detail.
* **Operation type.** Identifies the action executed.
* **Status.** Current situation of the execution: *In progress*, *Error*, *Finished*, or *Pending*.
* **Started by.** User who executed the operation.
* **Started on.** Start date and time of the execution.
* **Finished on.** End date and time of the execution.
* **Created on.** Date and time when the operation record was created.
* **FRA start.** Start date and time of Flexxible Remote Assistance (FRA), if applicable.
* **FRA end.** End date and time of Flexxible Remote Assistance (FRA), if applicable.
* **FRA type.** Type of Flexxible Remote Assistance (FRA) executed: *Attended*, *Unattended*, or *Dynamic*.
##### Operation detail
Selecting an operation from the table opens a detailed view that lets you analyze its execution and result.
##### Summary
This section shows consolidated information about the operation:
* **Operation type**
* **Description**
* **Started on**
* **Finished on**
* **Started by**
* **Status (Global).** Overall status of the operation.
* **Status (Workspace).** Specific status of the operation on the device.
* **Workspaces.** Devices associated with the operation.
* **Summary.** Visual indicator of the overall result of the operation:
* Green: *Finished*
* Yellow: *Pending*
* Red: *Error*
* Gray: *Unknown*
##### Events
This section shows the history of events generated by the system during the execution of the operation, which lets you diagnose errors or verify progress.
Each event includes:
* **Date.** Date and time when the event was recorded.
* **Type.** Event level: *Information*, *Error*, or *Critical*.
* **Source.** System component that generated the event.
* **Message.** Detailed description of the event.
The **View full events** button redirects to the Operations section, where you can consult expanded information and the full execution history.
#### 8. Sessions
Shows active or recorded sessions, with details such as:
* **User.** Name of the user signed in to the device.
* **Session type.** Type of session started (*Device* or *Application*, for virtualized application sessions).
* **Windows session ID.** Unique identifier assigned to each user session.
* **Connection status.** Status of the session connection (*Disconnected* or *Active*).
* **Start date.** Date and time when the session started.
* **CPU usage.** Percentage of processor usage of the session, excluding the resources used by other sessions or system processes.
* **RAM usage.** Amount of temporary memory used by the activities and applications of a specific user during a session.
* **RTT usage.** Time it takes for a data packet to travel from the user's device to a server or remote destination and then back to the user.
#### 9. Windows services
Contains the list of operating system services, including:
* **Display name.** Name of the programs that run in the background.
* **Status.** Status of the Windows services (*Running* or *Stopped*).
* **Start type.** How the service has been activated (*Automatic*, *Manual*, or *Disabled*).
* **Log on as.** Sign-in mode.
* **Accept stop.** Whether Windows services can be stopped or not (*Yes* or *No*)
#### 10. Disks
Shows the partitions of the device with the following information:
* **Device ID.** Name of the device.
* **Name.** Name of the disk's main partition.
* **Encrypted.** Indicates whether the device is encrypted, or whether no value is available (N/A).
* **Encryption method.** Indicates the encryption method.
* **Volume label.** Name of the volume label.
* **Total size.** In megabytes, total disk space.
* **Used size.** In megabytes, used disk space.
* **Used percentage.** As a percentage, used disk space.
* **OS drive.** Drive ownership (*Yes* or *No*).
* **Location.** Path to the disk's location.
* **Partition.** Indicates the number of storage divisions the disk has.
#### 11. Reporting group history
Shows the current and previous reporting groups for the device:
* **Source.** Reporting group the device came from.
* **Target.** Reporting group the device is entering.
* **Assignment type.** *Manual* or *Automatic* assignment.
* **Requested date.** Date and time of the device's reporting group change.
#### 12. PnP events
Shows a table with the list of Plug and Play events recorded on the device. The information includes:
* **Action.** Status of the hardware component (printer, mouse, etc.) with respect to the device (*Plugged in* or *Unplugged*).
* **Date.** Last PnP update recorded by FlexxAgent.
* **User.** User currently using the device.
* **Description.** Hardware component connected to the device.
* **Device ID.** Identification code of the hardware component connected to the device.
#### 13. PnP errors
Shows a table with the list of Plug and Play errors recorded on the device. The information includes:
* **Name.** Name of the hardware component connected to the device.
* **Update date.** Last PnP update recorded by FlexxAgent.
* **Class.** Type of hardware component connected to the device.
* **Device ID.** Identification code of the hardware component connected to the device.
#### 14. CrowdStrike detections
If the CrowdStrike integration has been set up from the platform, a table will be shown with information about threat detections, including the following fields:
* **Severity.** Criticality level assigned to the detection based on the potential impact or risk of the threat.
* **Created.** Date and time when the detection was generated in the system.
* **User name.** User associated with the activity or process that triggered the detection.
* **Status.** Current status of the detection.
* **Display name.** Descriptive name assigned to the detection, which summarizes the type of threat or behavior identified.
* **Description.** Expanded information about the detection.
* **Command line.** Command or instruction executed on the device that generated or is related to the detection.
FlexxAgent syncs CrowdStrike alerts every minute.
#### 15. Version history
Presents a table with the FlexxAgent versions that have been recorded on the device.
* **Version.** FlexxAgent version number detected on the device.
* **Discovered on.** Date and time when the system identified the presence of that FlexxAgent version on the device.
#### 16. Boot history
Through a chart, this section shows the record of the boot time the device has had.
#### 17. Installed updates
Presents a table with the list of updates installed on the device. The information includes:
* **Install date.** Date and time when the update was installed on the device.
* **KB.** Unique identifier of the update package issued by Microsoft.
* **Title.** Name of the update.
* **Product.** Name of the product to which the update applies.
* **Severity.** Criticality level assigned to the update according to its importance or impact on security (*Critical*, *Important*, *Moderate*, *Low*, *Unspecified*).
* **Arrival date.** Date when the update was published or made available by the vendor.
* **Category.** Functional or technical classification of the update.
#### 18. Pending updates
Shows a table with the list of updates pending on the device. The information includes:
* **KB.** Unique identifier of the update package issued by Microsoft.
* **Title.** Name of the update.
* **Product.** Name of the product to which the update applies.
* **Severity.** Criticality level assigned to the update according to its importance or impact on security (*Critical*, *Important*, *Moderate*, *Low*, *Unspecified*).
* **Arrival date.** Date when the update was published or made available by the vendor.
* **Category.** Functional or technical classification of the update.
#### 19. FlexxAgent logs
This section shows the log files generated by the agent and collected from the device.
##### Information available in the logs table
The logs table includes the following information:
* **File name.** Name of the file generated by FlexxAgent.
* **Session.** Identifier of the installation or execution session the log belongs to.
* **Size.** Size of the log file.
* **Uploaded on.** Date and time when the log was uploaded to the platform.
* **Actions.** Operations available for the log file.
* **View.** Displays the contents of the agent log.
* **Download.** Lets you download the log file for local analysis.
##### Collect agent logs
The **Collect agent logs** button, located at the top of the table, lets you request log collection from the device for the time interval for which you want to obtain the logs.
Collection generates an operation that can be monitored from the Operations section.
##### Log retention
**FlexxAgent** stores logs locally on the device for a maximum period of five days. After that time, older files are automatically deleted.
##### Log location on the device
In addition to being viewable from the platform, logs can be consulted directly on the system where the agent is installed.
For more information, see the [FlexxAgent](../../flexxagent/systems/windows) documentation.
FlexxAgent logs is only available on devices that have FlexxAgent cross-platform version 26.1.501.195 installed.
#### 19. Workspace groups
This section shows a table with the list of workspace groups the device belongs to.
The table includes the following fields:
* **Name.** Name of the workspace group.
* **Description.** Brief text explaining the purpose of the group.
* **Type.** Can be *Static*, *Dynamic*, or *Entra ID*.
* **Workspaces.** Total number of devices that are currently part of the group.