> ## Documentation Index
> Fetch the complete documentation index at: https://docs.flexxible.com/llms.txt
> Use this file to discover all available pages before exploring further.
# Summary
This section presents indicators that let you identify the web applications with the highest latency, error rate, and number of anomalies. It also provides information about the number of devices accessing each application, the access dates, and the evolution of usage over time.
 ## Experience index
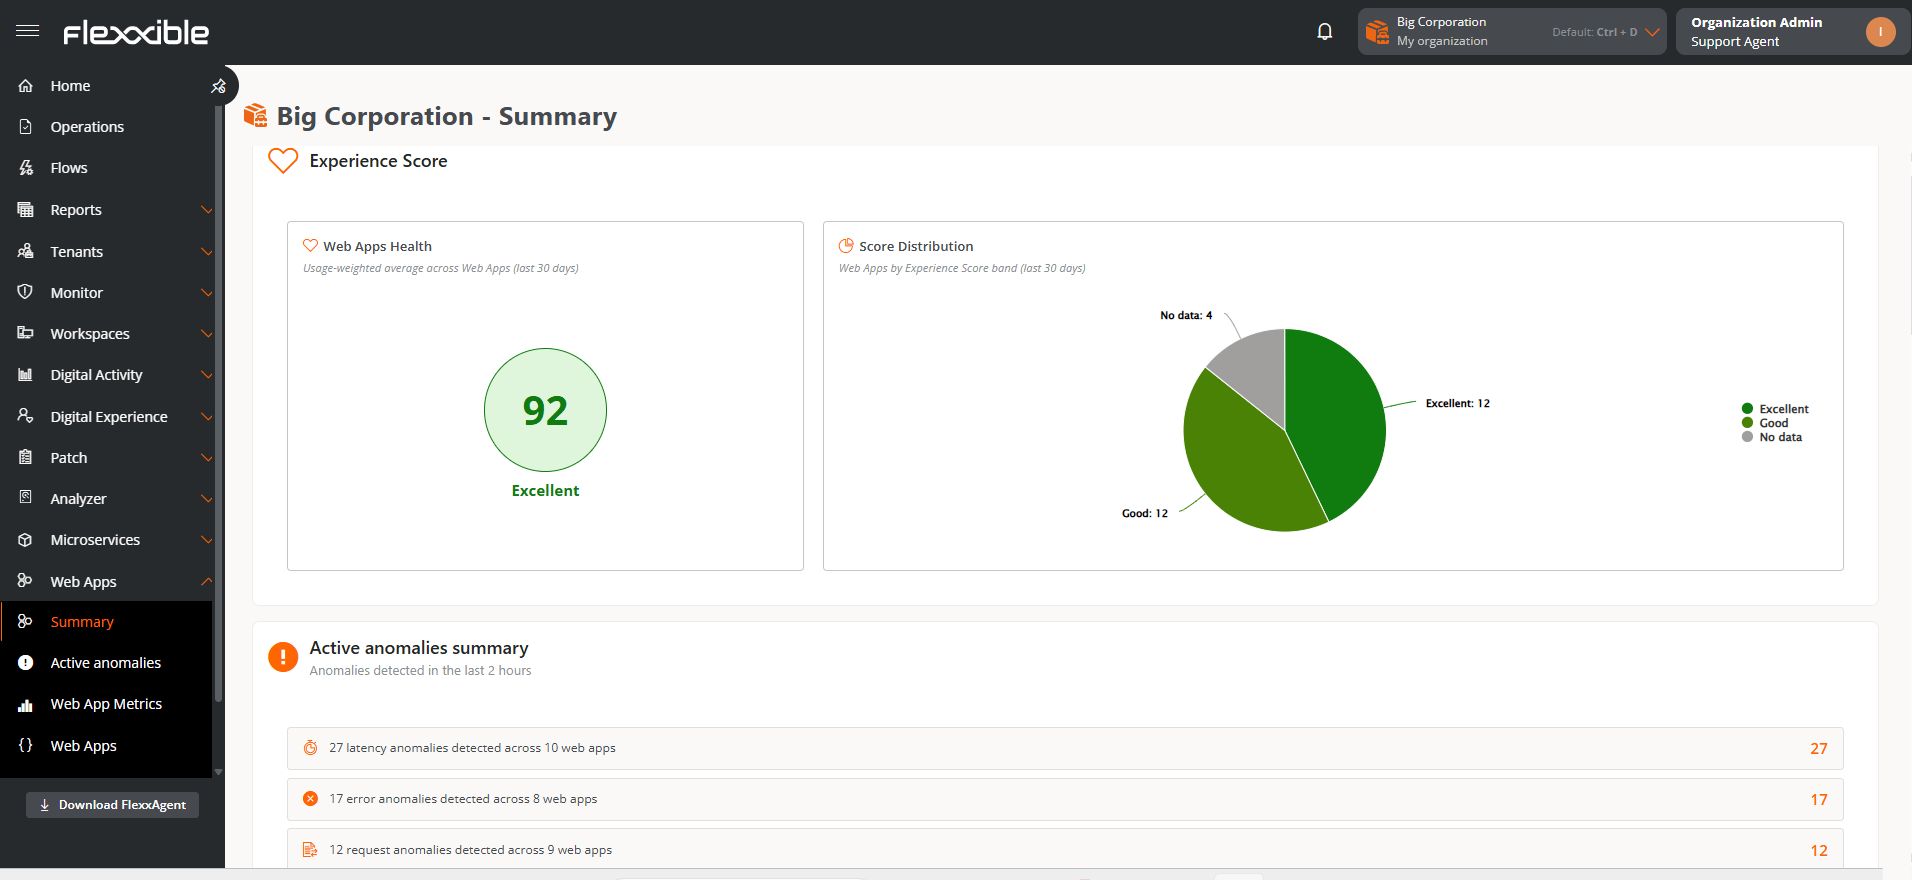
The experience index is a composite metric that reflects the overall quality of web applications from the end user's perspective. Its purpose is to provide a quick, unified view of the application's status.
This indicator combines request reliability, response speed, and stability, based on anomaly detection. It allows you to easily identify the level of experience that web applications provide and to detect areas for improvement.
### Score
The experience index is represented by a score between 0 and 100, where higher values indicate a better user experience:
* **90–100** — Excellent (Green)
* **75–89** — Good (Light green)
* **60–74** — Fair (Yellow)
* **40–59** — Poor (Orange)
* **0–39** — Critical (Red)
In addition, when applicable, the following is also indicated:
* **Insufficient data.** The recorded request volume is not enough to calculate a representative index. It is not calculated to avoid inaccurate results.
* **No data.** No activity has been recorded on the web application during the analyzed period.
### Charts
The charts show indicators corresponding to the last 30 days:
## Experience index
The experience index is a composite metric that reflects the overall quality of web applications from the end user's perspective. Its purpose is to provide a quick, unified view of the application's status.
This indicator combines request reliability, response speed, and stability, based on anomaly detection. It allows you to easily identify the level of experience that web applications provide and to detect areas for improvement.
### Score
The experience index is represented by a score between 0 and 100, where higher values indicate a better user experience:
* **90–100** — Excellent (Green)
* **75–89** — Good (Light green)
* **60–74** — Fair (Yellow)
* **40–59** — Poor (Orange)
* **0–39** — Critical (Red)
In addition, when applicable, the following is also indicated:
* **Insufficient data.** The recorded request volume is not enough to calculate a representative index. It is not calculated to avoid inaccurate results.
* **No data.** No activity has been recorded on the web application during the analyzed period.
### Charts
The charts show indicators corresponding to the last 30 days:
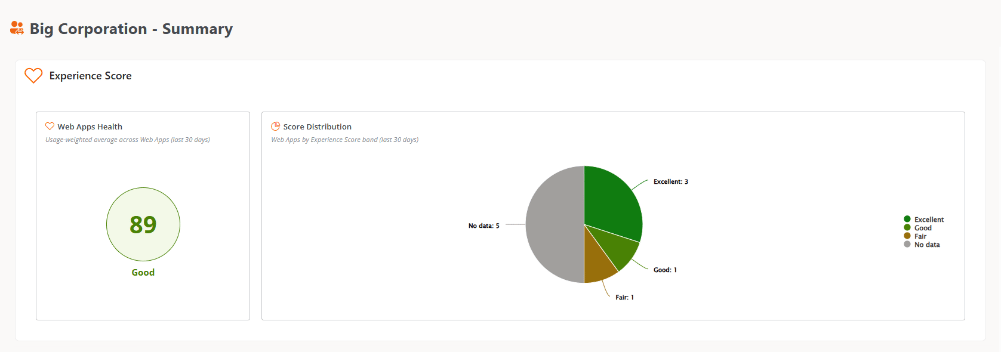 * **Web applications health.** Represents the weighted average of the experience index of the web applications based on their usage.
* **Distribution by experience index.** Shows the percentage of the distribution of web applications by their experience index.
## Active anomalies summary
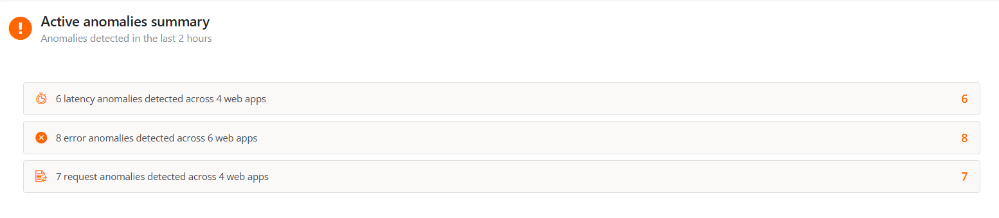
Provides access to the details of the anomalies detected with the highest incidence during the last two hours, to help detect potential current issues in the operation of web applications.
Anomalies are classified into the following categories: **Latency**, **Error**, and **Request**.
* **Web applications health.** Represents the weighted average of the experience index of the web applications based on their usage.
* **Distribution by experience index.** Shows the percentage of the distribution of web applications by their experience index.
## Active anomalies summary
Provides access to the details of the anomalies detected with the highest incidence during the last two hours, to help detect potential current issues in the operation of web applications.
Anomalies are classified into the following categories: **Latency**, **Error**, and **Request**.
 ## Top 5 Web Apps
Shows indicators that let you identify the five applications that stand out for certain metrics. Selecting an application from any of the indicators opens its details view.
The **View all** button opens the [Web Apps metrics](wa-metrics) table, automatically applying the filter corresponding to the selected indicator.
## Top 5 Web Apps
Shows indicators that let you identify the five applications that stand out for certain metrics. Selecting an application from any of the indicators opens its details view.
The **View all** button opens the [Web Apps metrics](wa-metrics) table, automatically applying the filter corresponding to the selected indicator.
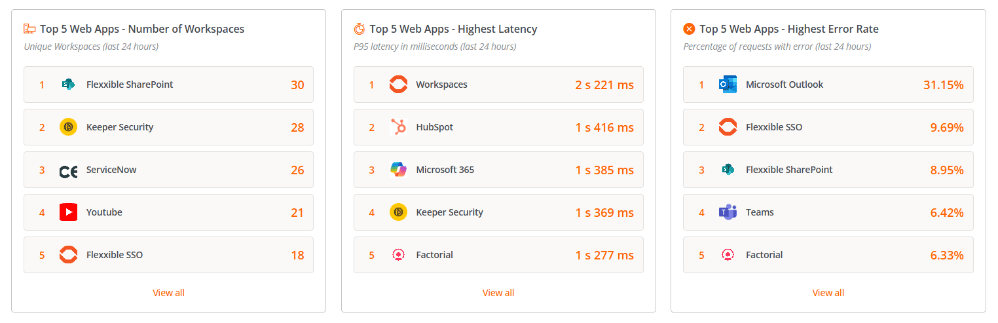 * **Number of workspaces**
Shows the most used applications by the number of unique devices that have made requests during the last 24 hours.
* **Highest latency**
Indicates the applications with the highest average latency, expressed in milliseconds, during the last 24 hours.
* **Highest error rate**
Presents the applications that have recorded the highest number of request errors during the last 24 hours.
* **Request count anomalies**
Identifies the applications that have recorded the highest number of anomalies related to request volume during the last 48 hours.
* **Most latency anomalies**
Shows the applications with the highest number of anomalies related to latency during the last 48 hours.
* **Most error count anomalies**
Presents the applications that have recorded the highest number of anomalies related to errors during the last 48 hours.
## Workspaces
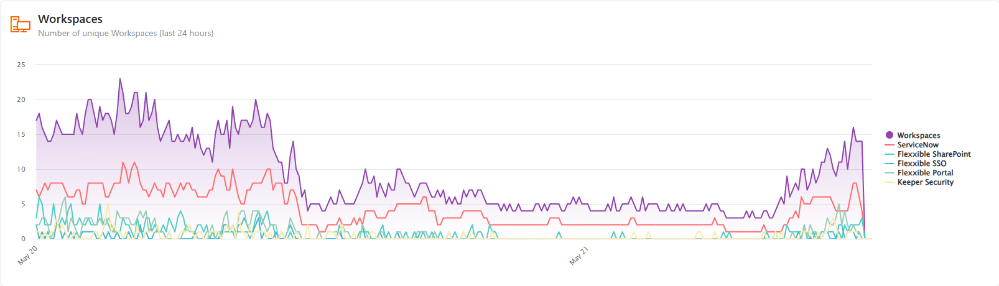
The chart shows the number of unique devices that have accessed the most used applications during the last 24 hours.
The legend on the right side lets you:
* Show only the data for a specific web application, keeping the other items dimmed.
* Show only the total number of devices by enabling the word *Workspaces* and disabling the other items.
* **Number of workspaces**
Shows the most used applications by the number of unique devices that have made requests during the last 24 hours.
* **Highest latency**
Indicates the applications with the highest average latency, expressed in milliseconds, during the last 24 hours.
* **Highest error rate**
Presents the applications that have recorded the highest number of request errors during the last 24 hours.
* **Request count anomalies**
Identifies the applications that have recorded the highest number of anomalies related to request volume during the last 48 hours.
* **Most latency anomalies**
Shows the applications with the highest number of anomalies related to latency during the last 48 hours.
* **Most error count anomalies**
Presents the applications that have recorded the highest number of anomalies related to errors during the last 48 hours.
## Workspaces
The chart shows the number of unique devices that have accessed the most used applications during the last 24 hours.
The legend on the right side lets you:
* Show only the data for a specific web application, keeping the other items dimmed.
* Show only the total number of devices by enabling the word *Workspaces* and disabling the other items.
 ## Requests
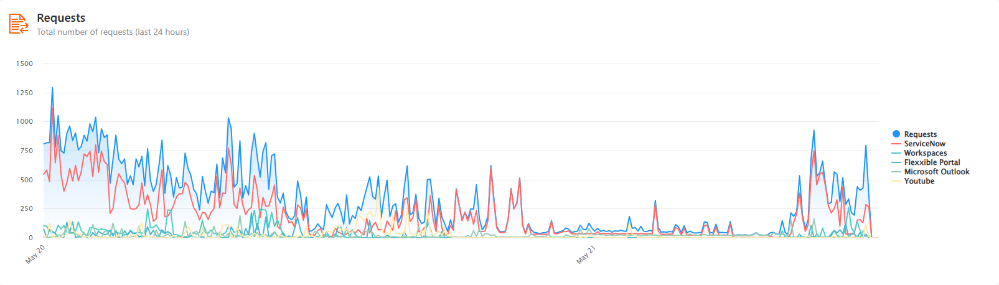
This line chart shows the number of requests made by users to each of the five most used web applications during the last 24 hours.
The legend on the right side lets you:
* Show only the data for a specific web application, keeping the other items dimmed.
* Show only the total requests by enabling the word *Requests* and disabling the other items.
## Requests
This line chart shows the number of requests made by users to each of the five most used web applications during the last 24 hours.
The legend on the right side lets you:
* Show only the data for a specific web application, keeping the other items dimmed.
* Show only the total requests by enabling the word *Requests* and disabling the other items.
 ## Errors
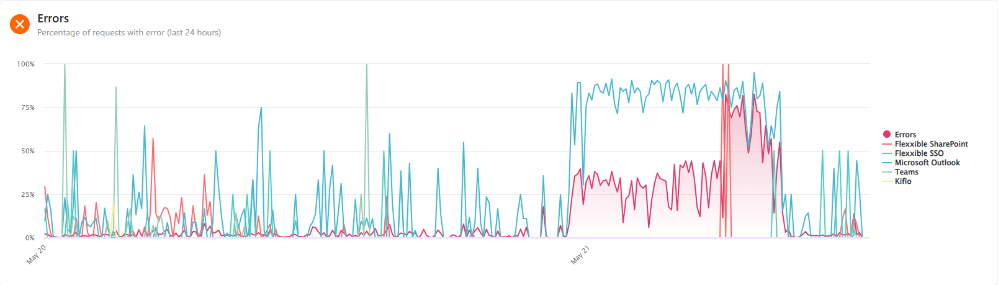
This chart shows the number of errors recorded when making requests to each of the five most consulted web applications during the last 24 hours.
The legend on the right side lets you:
* Show only the data for a specific web application, keeping the other items dimmed.
* Show only the total errors by enabling the word *Errors* and disabling the other items.
## Errors
This chart shows the number of errors recorded when making requests to each of the five most consulted web applications during the last 24 hours.
The legend on the right side lets you:
* Show only the data for a specific web application, keeping the other items dimmed.
* Show only the total errors by enabling the word *Errors* and disabling the other items.