> ## Documentation Index
> Fetch the complete documentation index at: https://docs.flexxible.com/llms.txt
> Use this file to discover all available pages before exploring further.
# Metrics
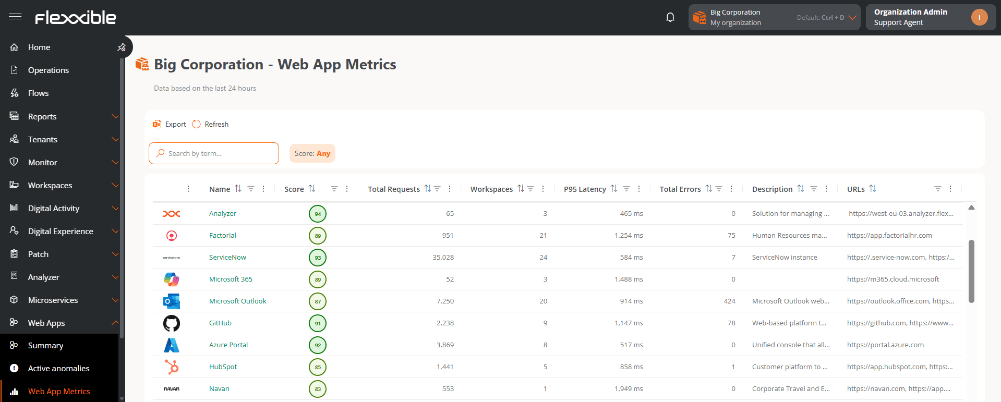
This section provides an overall view of the status of all web applications enabled in the organization. Its purpose is to provide quick access to the key performance and usage metrics, allowing you to detect incidents early.
 ## Enabled applications table
Shows information corresponding to the last 24 hours:
* **Name.** Main identifier of the web application. It is clickable and provides access to its details view.
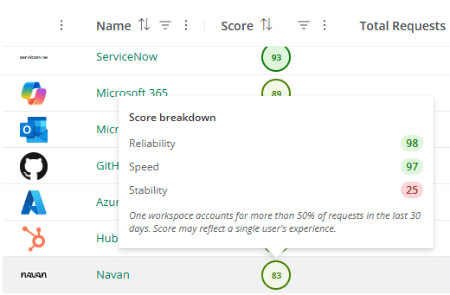
* **Experience index.** Metric that reflects the overall quality of the web application from the end user's perspective. Hovering over the score shows the breakdown of the value by **Reliability**, **Speed**, and **Stability**.
## Enabled applications table
Shows information corresponding to the last 24 hours:
* **Name.** Main identifier of the web application. It is clickable and provides access to its details view.
* **Experience index.** Metric that reflects the overall quality of the web application from the end user's perspective. Hovering over the score shows the breakdown of the value by **Reliability**, **Speed**, and **Stability**.
 * **Total requests.** Total number of requests made by users to the application.
* **Workspaces.** Total number of unique devices that have reported activity on the application.
* **P95 latency.** Maximum response time within which 95% of the requests made to the web application are completed.
* **Total errors.** Total number of errors recorded during requests.
* **Description.** Descriptive summary of the application.
* **URL.** Web addresses linked to the application.
## Details of a web application
Selecting an application opens its details view, which is made up of the following sections:
* Details
* Summary
* Reliability
* Anomalies
* Metrics by workspace
* Request log
### Details
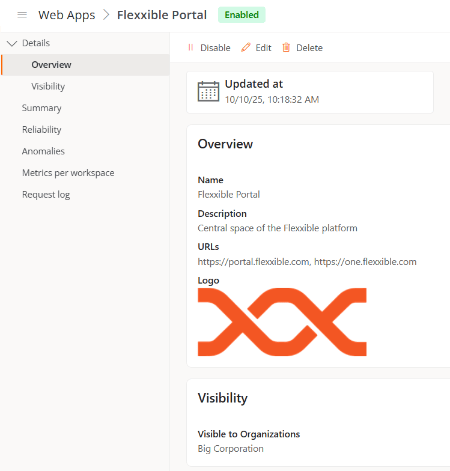
Presents the general information of the web application.
#### Summary panel
* **Created by.** User who registered the application.
* **Created on.** Date and time of creation.
* **Updated by.** User who made the last modification.
* **Updated on.** Date and time of the last update.
#### Overview
Includes the main information about the application:
* **Name.** Application identifier.
* **Description.** Descriptive summary.
* **URL.** Linked web addresses.
* **Logo.** Identifying image.
* **Total requests.** Total number of requests made by users to the application.
* **Workspaces.** Total number of unique devices that have reported activity on the application.
* **P95 latency.** Maximum response time within which 95% of the requests made to the web application are completed.
* **Total errors.** Total number of errors recorded during requests.
* **Description.** Descriptive summary of the application.
* **URL.** Web addresses linked to the application.
## Details of a web application
Selecting an application opens its details view, which is made up of the following sections:
* Details
* Summary
* Reliability
* Anomalies
* Metrics by workspace
* Request log
### Details
Presents the general information of the web application.
#### Summary panel
* **Created by.** User who registered the application.
* **Created on.** Date and time of creation.
* **Updated by.** User who made the last modification.
* **Updated on.** Date and time of the last update.
#### Overview
Includes the main information about the application:
* **Name.** Application identifier.
* **Description.** Descriptive summary.
* **URL.** Linked web addresses.
* **Logo.** Identifying image.
 #### Visibility
Indicates the organizations and sub-organizations in which the web application is available.
### Summary
Shows the experience index that the web application reflects, as well as the general access statistics based on the requests made by users.
**Experience index**
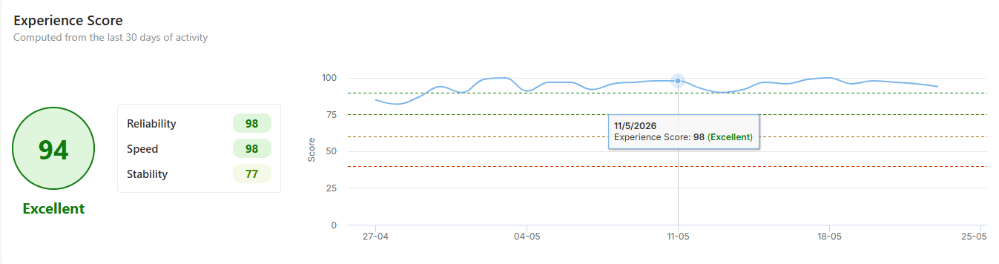
The **experience index** result is represented by a score between 0 and 100, based on an average of the last 30 days (weighted by the use of the web application during that period).
Based on the score obtained, the web application is classified as follows:
* **90–100** — Excellent (Green)
* **75–89** — Good (Light green)
* **60–74** — Fair (Yellow)
* **40–59** — Poor (Orange)
* **0–39** — Critical (Red)
#### Visibility
Indicates the organizations and sub-organizations in which the web application is available.
### Summary
Shows the experience index that the web application reflects, as well as the general access statistics based on the requests made by users.
**Experience index**
The **experience index** result is represented by a score between 0 and 100, based on an average of the last 30 days (weighted by the use of the web application during that period).
Based on the score obtained, the web application is classified as follows:
* **90–100** — Excellent (Green)
* **75–89** — Good (Light green)
* **60–74** — Fair (Yellow)
* **40–59** — Poor (Orange)
* **0–39** — Critical (Red)
 In addition, when applicable, the following is also indicated:
* **Insufficient data.** The recorded request volume is not enough to calculate a representative index. It is not calculated to avoid inaccurate results.
* **No data.** No activity has been recorded on the web application during the analyzed period.
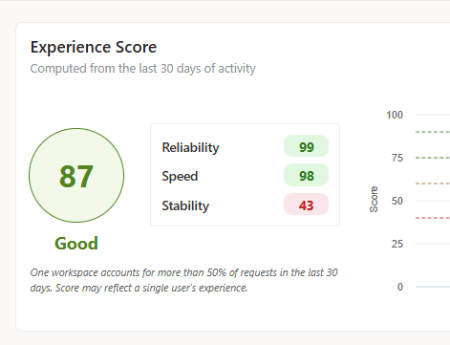
If there is a clearly dominant user, that is, one who accounts for more than 50% of the requests, this information is also shown to provide additional context.
In addition, when applicable, the following is also indicated:
* **Insufficient data.** The recorded request volume is not enough to calculate a representative index. It is not calculated to avoid inaccurate results.
* **No data.** No activity has been recorded on the web application during the analyzed period.
If there is a clearly dominant user, that is, one who accounts for more than 50% of the requests, this information is also shown to provide additional context.
 **Summary**
#### Summary panel
Shows the following quantitative values:
* Requests
* Errors
* Latency
* Workspaces
#### Time range
The information can be viewed for the following periods:
* Last 24 hours
* Last 7 days
* Last 14 days
#### Charts
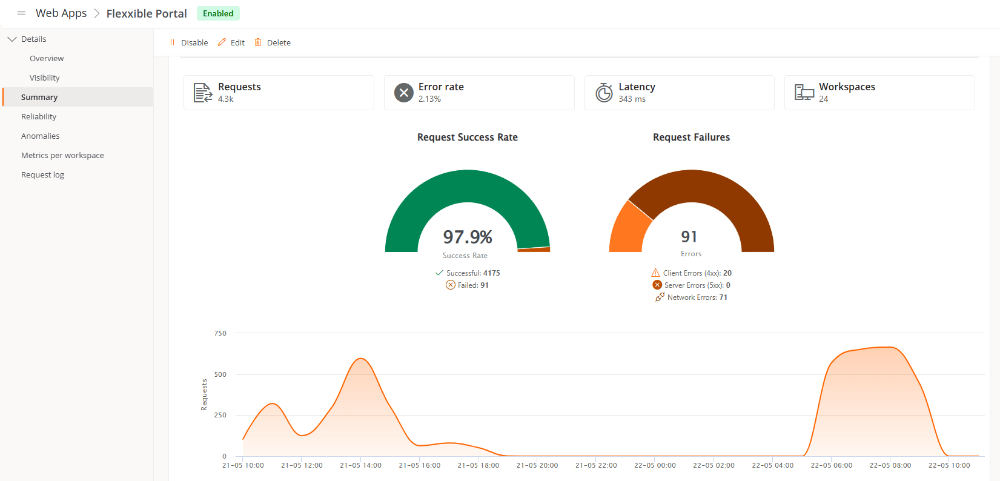
Two pie charts are presented showing the success and failed request rates.
Failed requests are classified into *Client errors (4xx)*, *Server errors (5xx)*, and *Network errors*.
**Summary**
#### Summary panel
Shows the following quantitative values:
* Requests
* Errors
* Latency
* Workspaces
#### Time range
The information can be viewed for the following periods:
* Last 24 hours
* Last 7 days
* Last 14 days
#### Charts
Two pie charts are presented showing the success and failed request rates.
Failed requests are classified into *Client errors (4xx)*, *Server errors (5xx)*, and *Network errors*.
 Request evolution:
* Includes a line chart representing the evolution of requests during the selected period.
* Hovering the cursor over a point on the chart shows the values corresponding to the selected date and time.
### Reliability
This section presents line charts oriented to the analysis of the web application's behavior and stability:
The charts show:
* P95 latency (ms) of total requests
* Errors recorded during access
* Error rate
* Workspaces
Request evolution:
* Includes a line chart representing the evolution of requests during the selected period.
* Hovering the cursor over a point on the chart shows the values corresponding to the selected date and time.
### Reliability
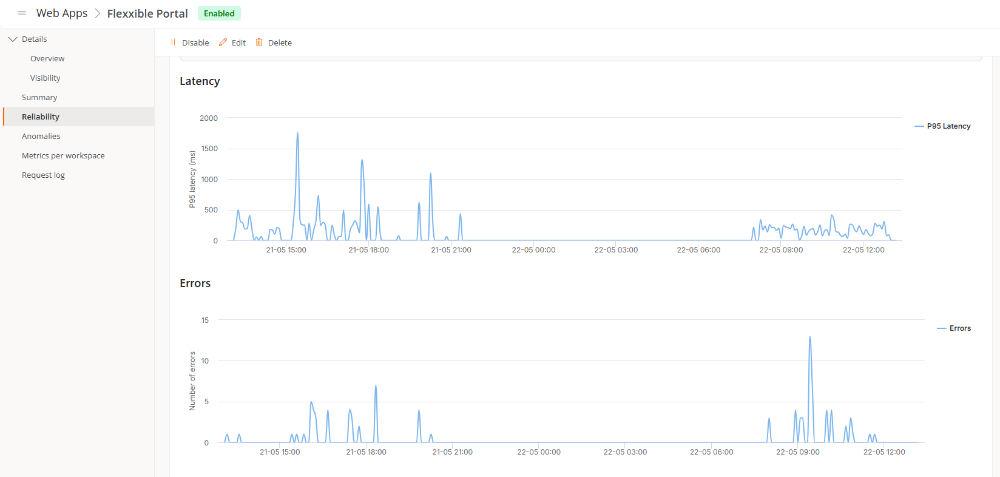
This section presents line charts oriented to the analysis of the web application's behavior and stability:
The charts show:
* P95 latency (ms) of total requests
* Errors recorded during access
* Error rate
* Workspaces
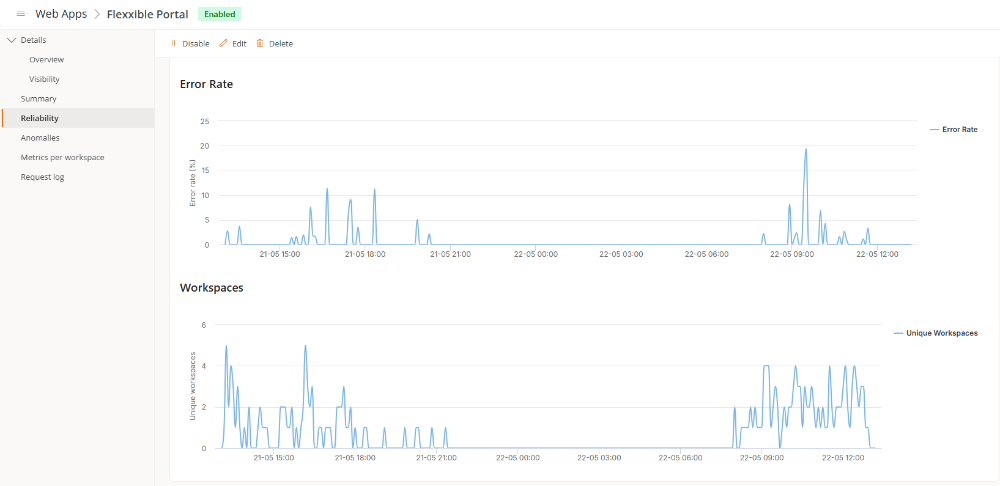 The information adapts to the selected time range, the applied filters, and the configured segmentation.
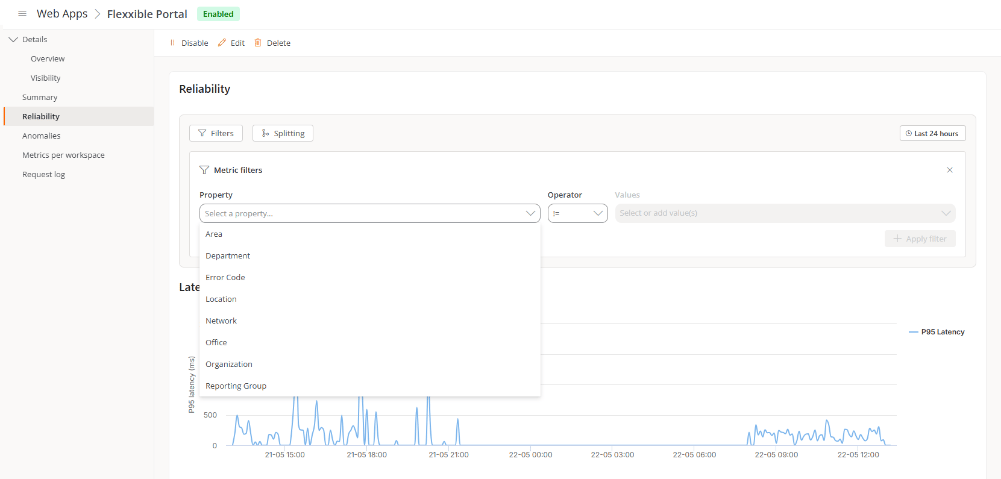 #### Time range
The information can be viewed for the following periods:
* Last 24 hours
* Last 7 days
* Last 14 days
* Last 30 days
* Last 90 days
#### Filters
The **Metrics filters** enable a detailed analysis of latency and errors through the following parameters:
* **Property.** **Reporting group**, **Network**, **Location**, **Area**, **Department**, **Office**, **Organization**, and **Error code**.
* **Operator.** **=** (Equal to) and **!=** (Not equal to).
* **Values.** Depend on the selected property.
#### Split
Lets you segment the information shown in the charts by different properties.
Available configuration:
* **Property.** **Reporting group**, **Network**, **Location**, **Area**, **Department**, **Office**, **Organization**, and **Error code**.
* **Limit.** Lets you show between 1 and 100 splits per property.
* **Sort.** Lets you change the sorting to **Ascending** or **Descending**.
This level of segmentation makes it easier to identify groups of devices where latency or error problems are concentrated.
### Anomalies
This section lets you compare the usual behavior of a web application with the behavior detected in the last 48 hours, making it easier to detect anomalies.
To determine the values considered usual, the system performs a prior training based on historical data from 15 to 30 days. From this analysis, the normal behavior range is established for each metric.
#### Summary panel
Shows the following quantitative indicators:
* Total anomalies
* Request anomalies
* Error anomalies
* Latency anomalies
#### Time range
The information can be viewed for the following periods:
* Last 24 hours
* Last 7 days
* Last 14 days
* Last 30 days
* Last 90 days
#### Filters
The **Metrics filters** enable a detailed analysis of latency and errors through the following parameters:
* **Property.** **Reporting group**, **Network**, **Location**, **Area**, **Department**, **Office**, **Organization**, and **Error code**.
* **Operator.** **=** (Equal to) and **!=** (Not equal to).
* **Values.** Depend on the selected property.
#### Split
Lets you segment the information shown in the charts by different properties.
Available configuration:
* **Property.** **Reporting group**, **Network**, **Location**, **Area**, **Department**, **Office**, **Organization**, and **Error code**.
* **Limit.** Lets you show between 1 and 100 splits per property.
* **Sort.** Lets you change the sorting to **Ascending** or **Descending**.
This level of segmentation makes it easier to identify groups of devices where latency or error problems are concentrated.
### Anomalies
This section lets you compare the usual behavior of a web application with the behavior detected in the last 48 hours, making it easier to detect anomalies.
To determine the values considered usual, the system performs a prior training based on historical data from 15 to 30 days. From this analysis, the normal behavior range is established for each metric.
#### Summary panel
Shows the following quantitative indicators:
* Total anomalies
* Request anomalies
* Error anomalies
* Latency anomalies
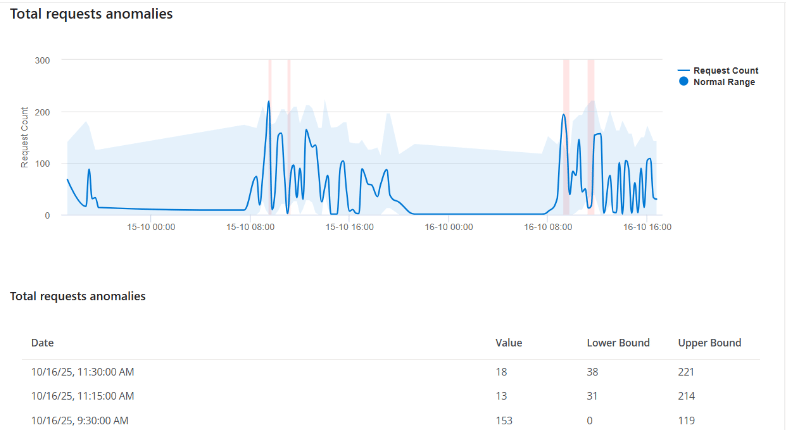
 #### Total request anomalies
This chart compares the number of detected requests with the expected normal range over a 48-hour period.
* **Blue shading.** Represents the usual request range.
* **Blue line.** Shows the requests recorded during the last 48 hours.
* **Red shading.** Indicates intervals where an anomaly was detected.
When the blue line exceeds the normal range represented by the blue area, it is interpreted that the request volume is higher than the expected behavior.
#### Total request anomalies
This chart compares the number of detected requests with the expected normal range over a 48-hour period.
* **Blue shading.** Represents the usual request range.
* **Blue line.** Shows the requests recorded during the last 48 hours.
* **Red shading.** Indicates intervals where an anomaly was detected.
When the blue line exceeds the normal range represented by the blue area, it is interpreted that the request volume is higher than the expected behavior.
 #### Total error anomalies
This chart compares the number of errors detected with the expected normal range over a 48-hour period.
#### Total error anomalies
This chart compares the number of errors detected with the expected normal range over a 48-hour period.
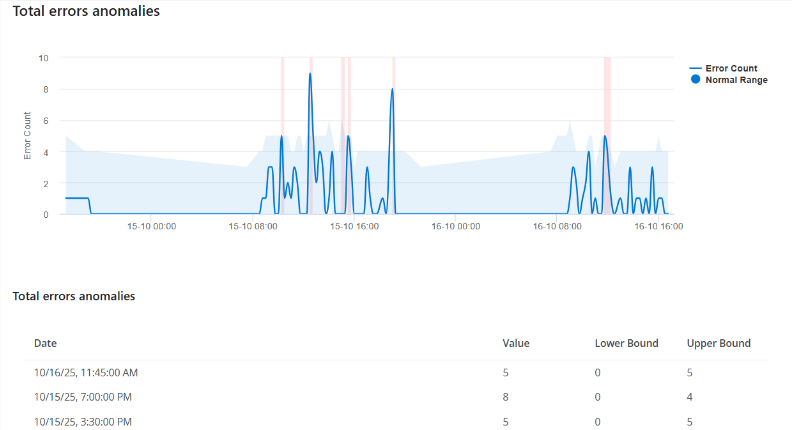 * **Blue shading.** Represents the usual error range.
* **Blue line.** Shows the errors detected during the last 48 hours.
* **Red shading.** Marks intervals with anomalous behavior.
When the blue line exceeds the usual range, it means more errors than expected have been recorded.
#### Average latency anomalies
This chart represents the evolution of the average latency compared with its usual range.
* **Blue shading.** Represents the usual error range.
* **Blue line.** Shows the errors detected during the last 48 hours.
* **Red shading.** Marks intervals with anomalous behavior.
When the blue line exceeds the usual range, it means more errors than expected have been recorded.
#### Average latency anomalies
This chart represents the evolution of the average latency compared with its usual range.
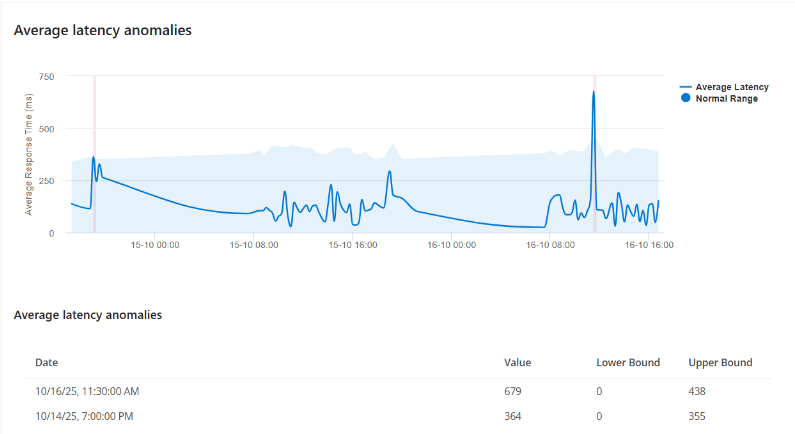 * **Blue shading.** Represents the normal latency range.
* **Blue line.** Shows the latency recorded during the last 48 hours.
* **Red shading.** Marks periods where an anomaly was detected.
When the blue line exceeds the usual range, it is interpreted that the application shows response times higher than normal.
#### Legends
The legends let you toggle the visualization of the different elements of the chart:
* **Normal range.** Shows the expected normal range.
* **Number of requests.** Shows the actual recorded values.
Hovering the cursor over a point on the chart shows the values corresponding to the selected date and time.
#### Tables
Below each chart is a table with the details of the detected values.
* Date and time
* Value
* Lower limit
* Upper limit
### Metrics by workspace
Lets you analyze the behavior of specific devices with respect to a web application.
* **Blue shading.** Represents the normal latency range.
* **Blue line.** Shows the latency recorded during the last 48 hours.
* **Red shading.** Marks periods where an anomaly was detected.
When the blue line exceeds the usual range, it is interpreted that the application shows response times higher than normal.
#### Legends
The legends let you toggle the visualization of the different elements of the chart:
* **Normal range.** Shows the expected normal range.
* **Number of requests.** Shows the actual recorded values.
Hovering the cursor over a point on the chart shows the values corresponding to the selected date and time.
#### Tables
Below each chart is a table with the details of the detected values.
* Date and time
* Value
* Lower limit
* Upper limit
### Metrics by workspace
Lets you analyze the behavior of specific devices with respect to a web application.
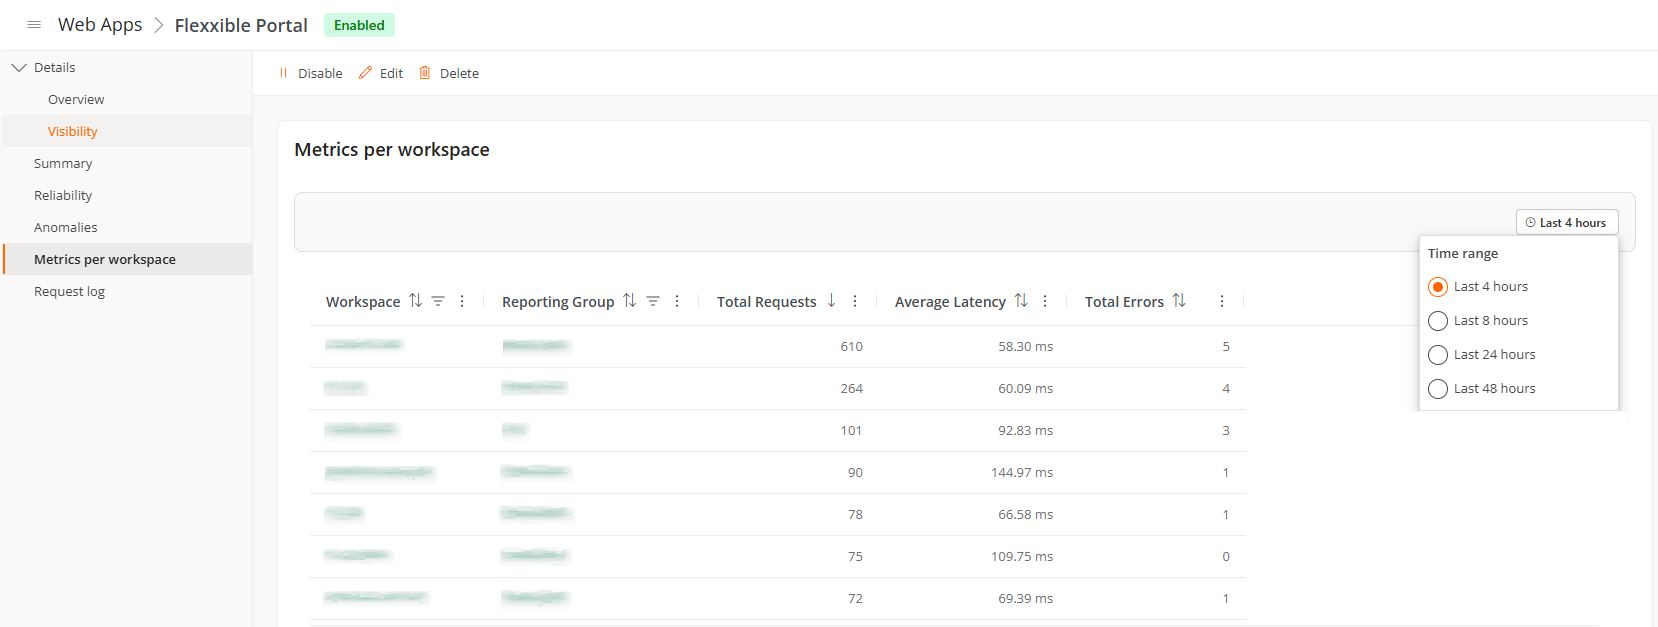 Table contents:
* **Workspace.** Name of the device that made the requests.
* **Reporting group.** Group the device belongs to.
* **Total requests.** Number of requests made.
* **Average latency.** Average response time in milliseconds.
* **Total errors.** Total number of errors recorded.
Selecting the device or reporting group name opens its details view.
#### Time range
The information can be viewed for the following periods:
* Last 4 hours
* Last 8 hours
* Last 24 hours
* Last 48 hours
### Request log
Shows detailed information about the requests and HTTP messages exchanged between the user's device and the server.
Table contents:
* **Workspace.** Name of the device that made the requests.
* **Reporting group.** Group the device belongs to.
* **Total requests.** Number of requests made.
* **Average latency.** Average response time in milliseconds.
* **Total errors.** Total number of errors recorded.
Selecting the device or reporting group name opens its details view.
#### Time range
The information can be viewed for the following periods:
* Last 4 hours
* Last 8 hours
* Last 24 hours
* Last 48 hours
### Request log
Shows detailed information about the requests and HTTP messages exchanged between the user's device and the server.
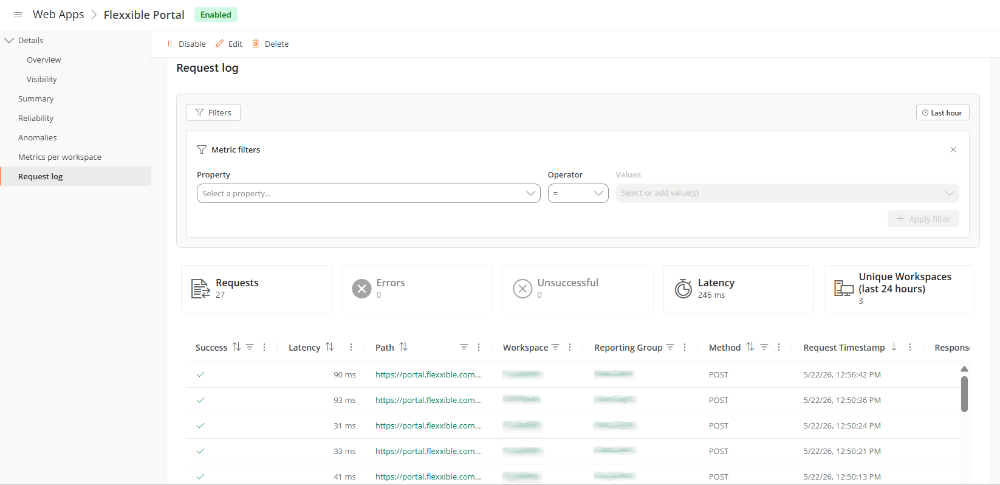 Table information:
* **Successful.** Indicator of a successful (:white\_check\_mark:) or failed (:x:) request.
* **Latency.** Response time in milliseconds.
* **Path.** Requested address.
* **Workspace.** Device from which the request was made.
* **Reporting group.** Group the device belongs to.
* **Method.** HTTP method used.
* **Timestamp.** Date and time of the request.
* **Response error code.** Detected error code, when applicable.
* **Response error message.** Detailed description of the recorded error.
* **Status.** HTTP status code returned by the server.
Table information:
* **Successful.** Indicator of a successful (:white\_check\_mark:) or failed (:x:) request.
* **Latency.** Response time in milliseconds.
* **Path.** Requested address.
* **Workspace.** Device from which the request was made.
* **Reporting group.** Group the device belongs to.
* **Method.** HTTP method used.
* **Timestamp.** Date and time of the request.
* **Response error code.** Detected error code, when applicable.
* **Response error message.** Detailed description of the recorded error.
* **Status.** HTTP status code returned by the server.
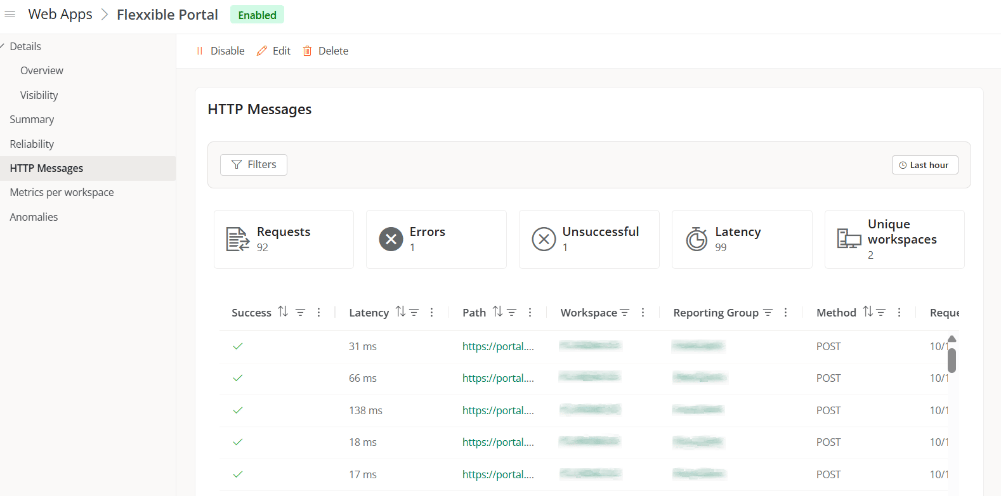 #### Time range
The data can be filtered by the following periods:
* Last 1 hour
* Last 4 hours
* Last 8 hours
#### Filters
The **Metrics filters** let you analyze requests by:
* **Property.** **Reporting group**, **Network**, **Location**, **Area**, **Department**, **Office**, **Organization**, and **Error code**.
* **Operator.** **=** (Equal to) and **!=** (Not equal to).
* **Values.** Depend on the selected property.
#### Summary panel
Shows the following quantitative indicators:
* Requests
* Errors
* Failed requests
* Latency
* Unique devices
#### Time range
The data can be filtered by the following periods:
* Last 1 hour
* Last 4 hours
* Last 8 hours
#### Filters
The **Metrics filters** let you analyze requests by:
* **Property.** **Reporting group**, **Network**, **Location**, **Area**, **Department**, **Office**, **Organization**, and **Error code**.
* **Operator.** **=** (Equal to) and **!=** (Not equal to).
* **Values.** Depend on the selected property.
#### Summary panel
Shows the following quantitative indicators:
* Requests
* Errors
* Failed requests
* Latency
* Unique devices
 ## Actions on web applications
This options menu lets you:
## Actions on web applications
This options menu lets you:
 ### Enable or disable a web application
Lets you enable or disable a web application within the organization. You can find more information in **Enable or disable a web application in the organization**.
### Edit
Opens a form to modify the web application's information.
#### Overview
* **Name.** Application identifier.
* **Description.** Descriptive summary.
* **URL.** Linked web addresses.
* **Logo.** Identifying image.
### Enable or disable a web application
Lets you enable or disable a web application within the organization. You can find more information in **Enable or disable a web application in the organization**.
### Edit
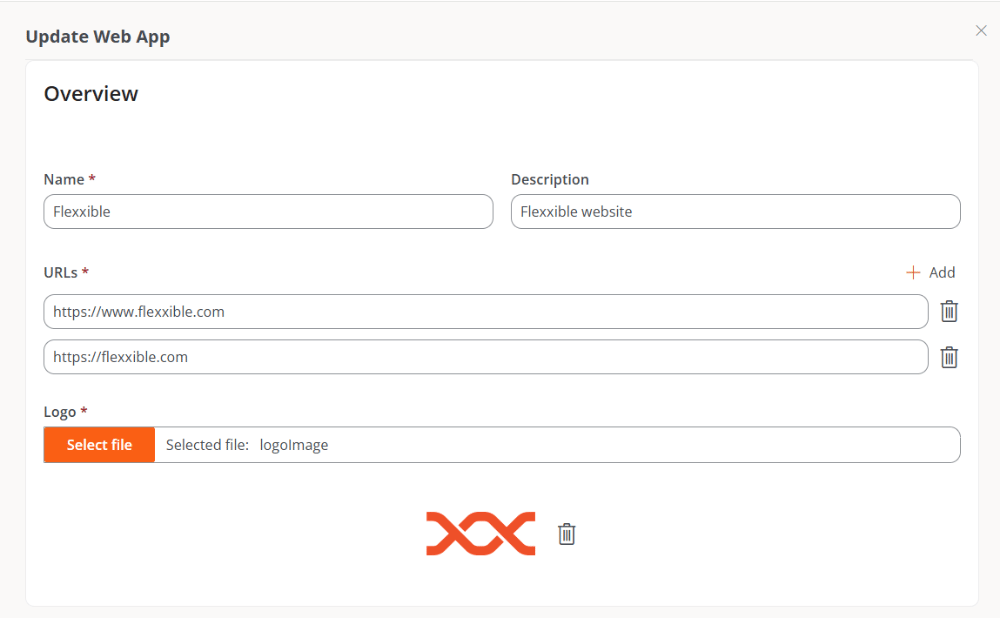
Opens a form to modify the web application's information.
#### Overview
* **Name.** Application identifier.
* **Description.** Descriptive summary.
* **URL.** Linked web addresses.
* **Logo.** Identifying image.
 #### Visibility
Lets you define the organizations and sub-organizations where the application will be available. An application being visible does not necessarily mean it is enabled.
If the visibility of an organization is removed, the application will no longer be available, even if associated historical data exists.
#### Visibility
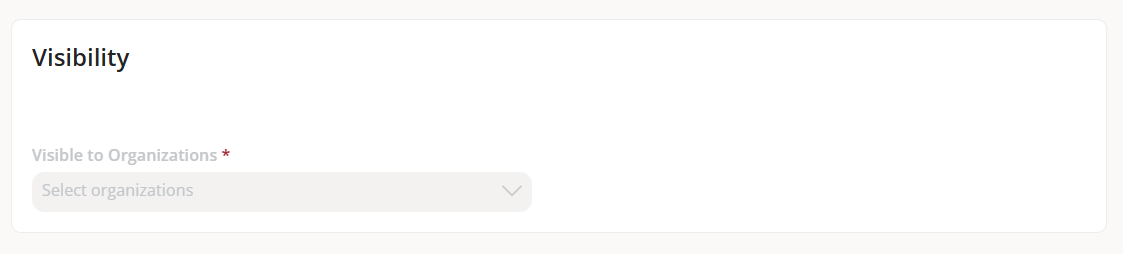
Lets you define the organizations and sub-organizations where the application will be available. An application being visible does not necessarily mean it is enabled.
If the visibility of an organization is removed, the application will no longer be available, even if associated historical data exists.
 ### Delete
When you delete a web application:
* It stops being visible in all organizations where it was available, except in the organization where it was created.
* In the creator organization:
* The application remains visible.
* It stops collecting new data.
* Historical data remains available for a maximum of 120 days.
* After that period, the application will no longer be shown.
* If the application never collected data, it will disappear immediately from all organizations.
### Delete
When you delete a web application:
* It stops being visible in all organizations where it was available, except in the organization where it was created.
* In the creator organization:
* The application remains visible.
* It stops collecting new data.
* Historical data remains available for a maximum of 120 days.
* After that period, the application will no longer be shown.
* If the application never collected data, it will disappear immediately from all organizations.