> ## Documentation Index
> Fetch the complete documentation index at: https://docs.flexxible.com/llms.txt
> Use this file to discover all available pages before exploring further.
# M365 summary
This section provides an overall view of the use and consumption of Microsoft 365 licenses in the organization. Its goal is to identify optimization and cost-reduction opportunities by analyzing purchased licenses, their assignment, and how users actually use Microsoft applications.
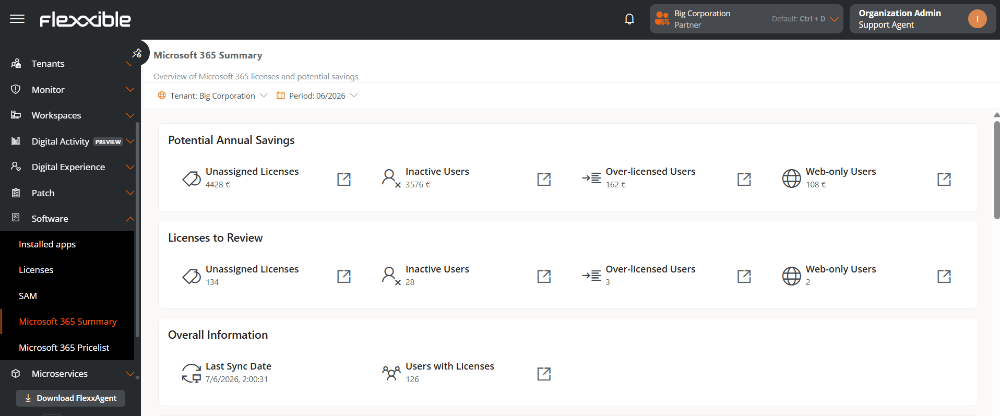 The available information helps you answer questions such as:
* What potential savings exist on purchased licenses that are not assigned?
* Which licenses are assigned to inactive users and what is their cost?
* Are there users with more comprehensive licenses than they actually need?
* Which users only use web applications and might require a different type of license?
* How do these metrics evolve over time?
## Requirement
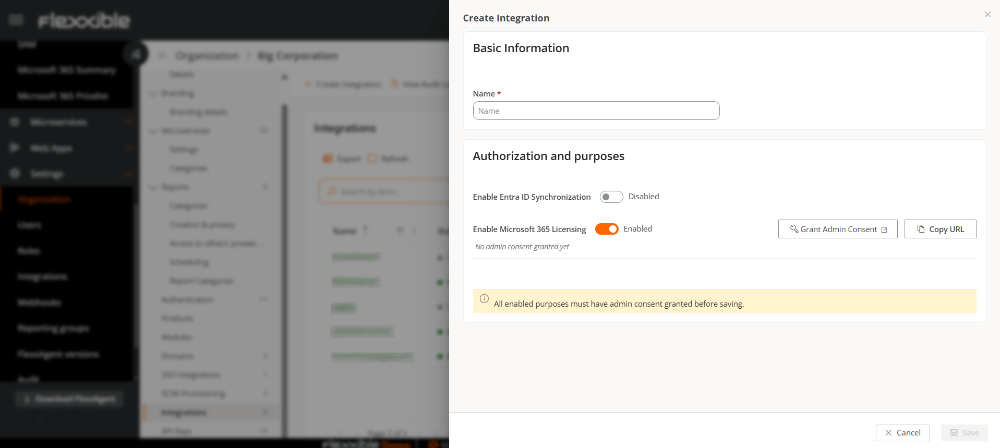
This feature is not enabled by default. To access it, you must first **enable Microsoft 365 licensing** from the **Integrations** section.
The available information helps you answer questions such as:
* What potential savings exist on purchased licenses that are not assigned?
* Which licenses are assigned to inactive users and what is their cost?
* Are there users with more comprehensive licenses than they actually need?
* Which users only use web applications and might require a different type of license?
* How do these metrics evolve over time?
## Requirement
This feature is not enabled by default. To access it, you must first **enable Microsoft 365 licensing** from the **Integrations** section.
 ## Information panels
The information is organized into panels that show relevant indicators for license usage and optimization:
* Potential annual savings
* Licenses to review
* General information
## Information panels
The information is organized into panels that show relevant indicators for license usage and optimization:
* Potential annual savings
* Licenses to review
* General information
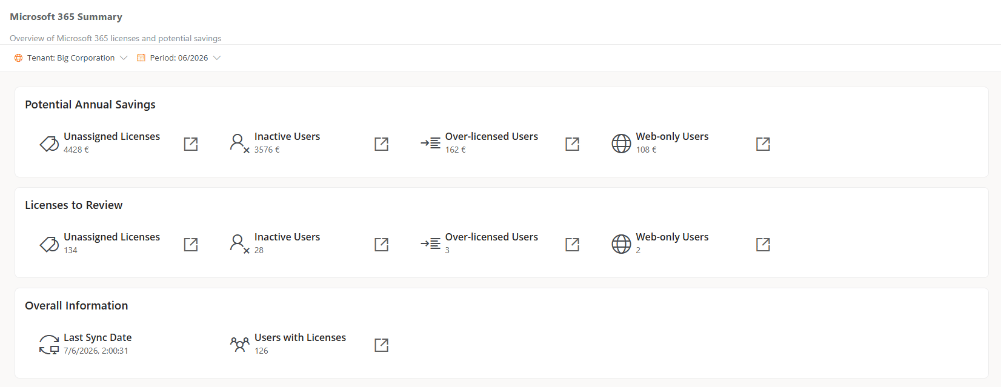 At the top of this view there are two selectors, **Tenant** and **Period**, that let you filter the data shown in each information panel. The selection does not apply to the historical evolution charts.
**Period**
Lets you select the time interval for which you want to view information.
* The available periods always correspond to calendar months.
* Only periods for which data is available are shown.
* By default, the most recent period is selected.
**Tenant**
If the organization has more than one tenant configured, this selector lets you choose the source of the data to be displayed in the view.
### Potential annual savings
Shows an estimate of the annual savings that could be achieved by optimizing licensing.
At the top of this view there are two selectors, **Tenant** and **Period**, that let you filter the data shown in each information panel. The selection does not apply to the historical evolution charts.
**Period**
Lets you select the time interval for which you want to view information.
* The available periods always correspond to calendar months.
* Only periods for which data is available are shown.
* By default, the most recent period is selected.
**Tenant**
If the organization has more than one tenant configured, this selector lets you choose the source of the data to be displayed in the view.
### Potential annual savings
Shows an estimate of the annual savings that could be achieved by optimizing licensing.
 * **Unassigned licenses.** Estimated annual amount corresponding to purchased licenses that are not assigned to any user.
* **Inactive users.** Estimated annual amount corresponding to licenses assigned to users with no activity in the last 90 days.
* **Users with excess licenses.** Estimated annual amount corresponding to users who have more comprehensive licenses than needed based on their usage of Microsoft applications.
* **Web-only users.** Estimated annual amount corresponding to users who exclusively use web applications, even though they have licenses that include desktop applications.
### Licenses to review
Shows the number of users or licenses in the licensing:
* **Unassigned licenses.** Estimated annual amount corresponding to purchased licenses that are not assigned to any user.
* **Inactive users.** Estimated annual amount corresponding to licenses assigned to users with no activity in the last 90 days.
* **Users with excess licenses.** Estimated annual amount corresponding to users who have more comprehensive licenses than needed based on their usage of Microsoft applications.
* **Web-only users.** Estimated annual amount corresponding to users who exclusively use web applications, even though they have licenses that include desktop applications.
### Licenses to review
Shows the number of users or licenses in the licensing:
 * **Unassigned licenses.** Purchased licenses that are not assigned to any user.
* **Inactive users.** Users with a license assigned who have had no activity in the last 90 days.
* **Users with excess licenses.** Users who might have a higher license than they need.
* **Web-only users.** Users who only use web applications.
### General information
Shows basic information about the current state of the licensing data.
* **Unassigned licenses.** Purchased licenses that are not assigned to any user.
* **Inactive users.** Users with a license assigned who have had no activity in the last 90 days.
* **Users with excess licenses.** Users who might have a higher license than they need.
* **Web-only users.** Users who only use web applications.
### General information
Shows basic information about the current state of the licensing data.
 * **Last synchronization date.** Date and time of the last licensing data update.
* **Users with licenses.** Total number of users with at least one license assigned.
Data synchronization processes run once a week and are recorded in the [Operations](../operations) section.
### Reports
To view the detailed data, each panel provides direct access to the corresponding report in the [Reports](../../reports/reports) section.
* **Last synchronization date.** Date and time of the last licensing data update.
* **Users with licenses.** Total number of users with at least one license assigned.
Data synchronization processes run once a week and are recorded in the [Operations](../operations) section.
### Reports
To view the detailed data, each panel provides direct access to the corresponding report in the [Reports](../../reports/reports) section.
 ## Historical evolution charts
The charts in this section let you analyze the evolution over time of the optimization metrics and verify the impact of measures applied to license usage.
### Evolution of potential annual savings
Shows the monthly evolution of the following metrics:
* Unassigned licenses
* Inactive users
* Users with excess licenses
* Web-only users
## Historical evolution charts
The charts in this section let you analyze the evolution over time of the optimization metrics and verify the impact of measures applied to license usage.
### Evolution of potential annual savings
Shows the monthly evolution of the following metrics:
* Unassigned licenses
* Inactive users
* Users with excess licenses
* Web-only users
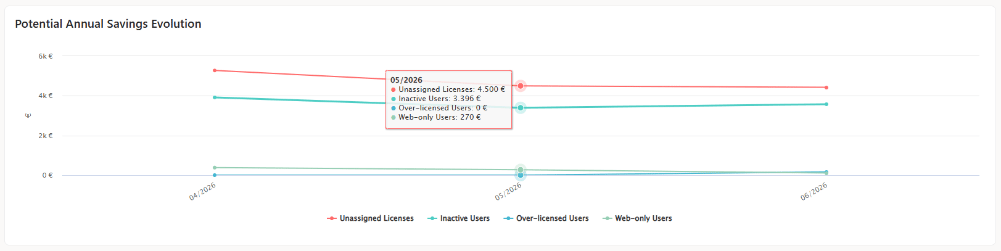 The chart lets you compare the evolution of the estimated potential annual savings for each of the categories analyzed.
Hovering the cursor over a point on the chart shows the values corresponding to that period.
### License evolution
Shows the monthly evolution of the following metrics:
The chart lets you compare the evolution of the estimated potential annual savings for each of the categories analyzed.
Hovering the cursor over a point on the chart shows the values corresponding to that period.
### License evolution
Shows the monthly evolution of the following metrics:
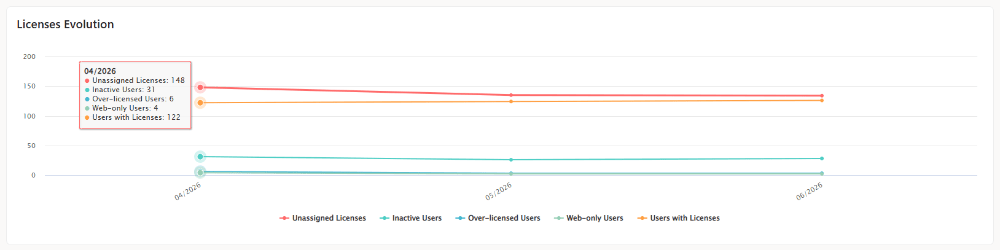 * Unassigned licenses
* Inactive users
* Users with excess licenses
* Web-only users
* Users with licenses
The chart lets you visualize how the different licensing metrics evolve over time and assess the impact of the optimization measures applied.
Hovering the cursor over a point on the chart shows the values corresponding to the selected period.
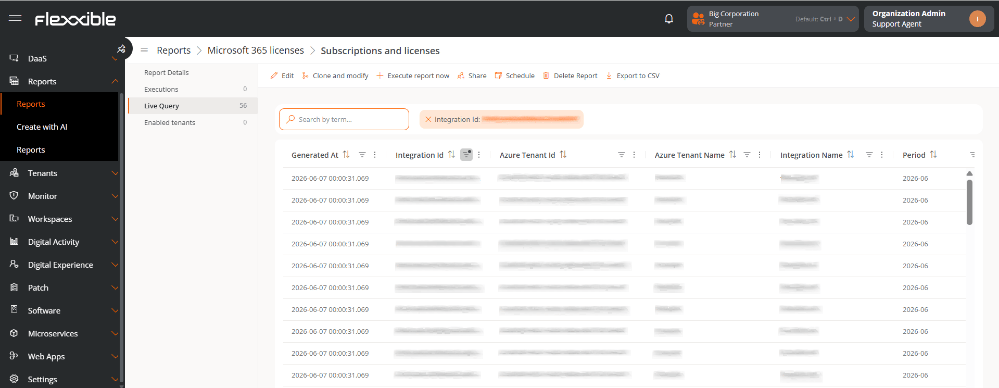
## Subscriptions and licenses
Shows detailed information about purchased licenses, their consumption, and their status.
### Table information
The table shows the following information:
* Unassigned licenses
* Inactive users
* Users with excess licenses
* Web-only users
* Users with licenses
The chart lets you visualize how the different licensing metrics evolve over time and assess the impact of the optimization measures applied.
Hovering the cursor over a point on the chart shows the values corresponding to the selected period.
## Subscriptions and licenses
Shows detailed information about purchased licenses, their consumption, and their status.
### Table information
The table shows the following information:
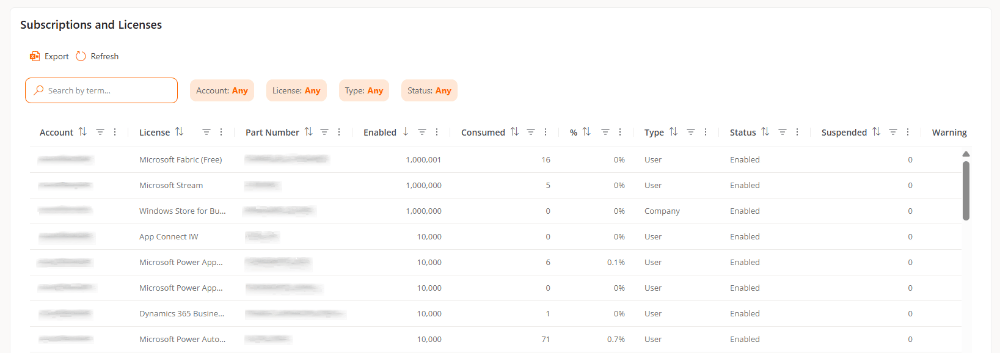 * **Account.** Microsoft Entra ID tenant to which the subscription belongs.
* **License.** Name of the purchased license.
* **Product code.** License reference code.
* **Enabled.** Total number of licenses available for the subscription.
* **Consumed.** Number of licenses currently assigned to users.
* **%.** Percentage of assigned licenses relative to the total available.
* **Type.** Subscription type or license mode.
* **Status.** Current status of the subscription.
* **Suspended.** Number of licenses included in suspended subscriptions.
* **Warning.** Number of licenses that are in a warning state and require some administrative action.
* **Blocked.** Number of licenses whose access to services has been restricted by Microsoft.
* **Next lifecycle.** Date on which the next change in the subscription lifecycle will occur.
* **Trial.** Indicates whether the subscription corresponds to a trial version.
* **Account.** Microsoft Entra ID tenant to which the subscription belongs.
* **License.** Name of the purchased license.
* **Product code.** License reference code.
* **Enabled.** Total number of licenses available for the subscription.
* **Consumed.** Number of licenses currently assigned to users.
* **%.** Percentage of assigned licenses relative to the total available.
* **Type.** Subscription type or license mode.
* **Status.** Current status of the subscription.
* **Suspended.** Number of licenses included in suspended subscriptions.
* **Warning.** Number of licenses that are in a warning state and require some administrative action.
* **Blocked.** Number of licenses whose access to services has been restricted by Microsoft.
* **Next lifecycle.** Date on which the next change in the subscription lifecycle will occur.
* **Trial.** Indicates whether the subscription corresponds to a trial version.